Fig. A.3.
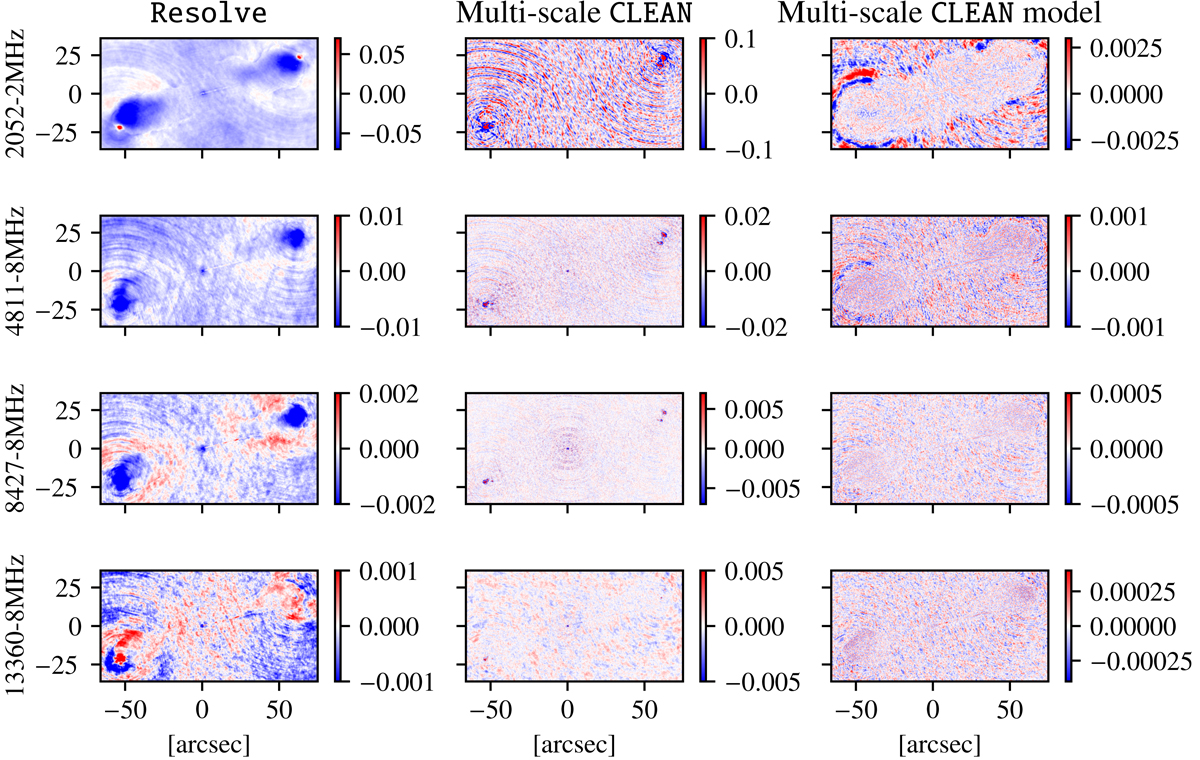
Residual maps. The first and second column display residual maps computed with the Bayesian weights. The third column displays the residual map for the multi-scale CLEAN model image with wsclean weighting. All colour bars have the unit Jy and are defined to be symmetric around zero with maximum five times the median of the absolute values of each image individually. The sign of the residual maps is determined by the r.h.s. of Eq. (31).
Current usage metrics show cumulative count of Article Views (full-text article views including HTML views, PDF and ePub downloads, according to the available data) and Abstracts Views on Vision4Press platform.
Data correspond to usage on the plateform after 2015. The current usage metrics is available 48-96 hours after online publication and is updated daily on week days.
Initial download of the metrics may take a while.