Open Access
Fig. 1.
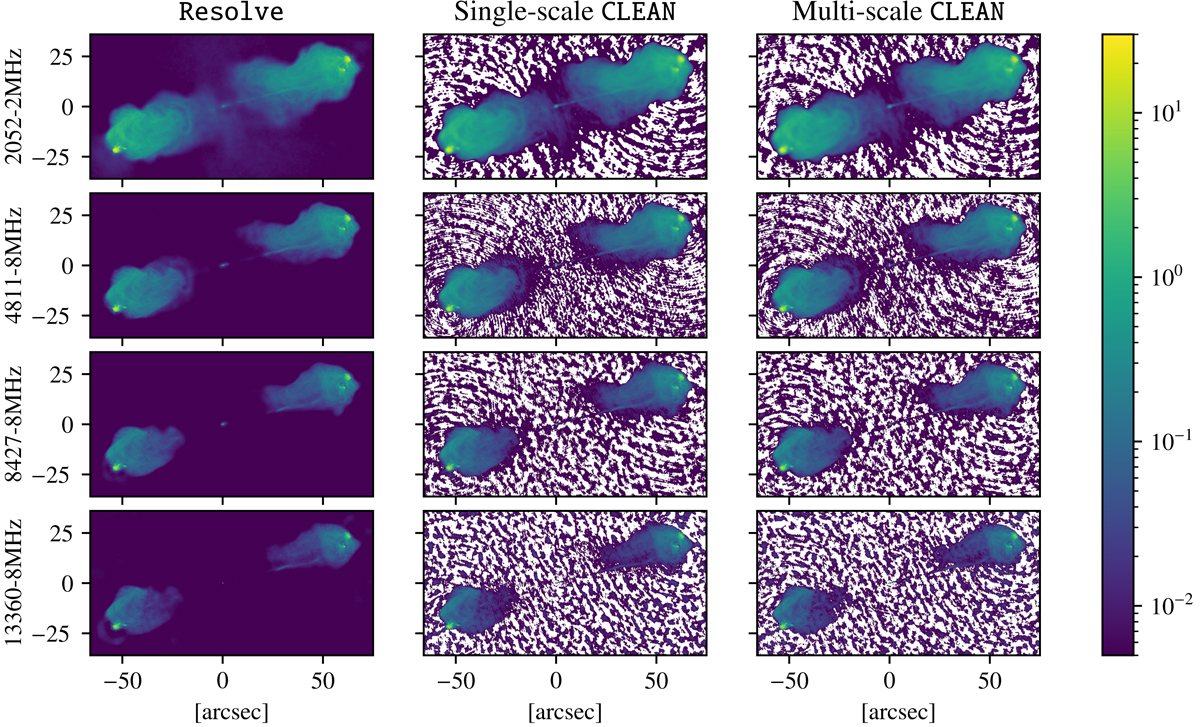
Overview of imaging results. The first column shows the resolve posterior mean, the middle and last column show single-scale CLEAN multi-scale CLEAN results, respectively. The colour bar has units Jy arcsec−2. Negative flux regions are displayed in white. See also different scaled version in Fig. A.6.
Current usage metrics show cumulative count of Article Views (full-text article views including HTML views, PDF and ePub downloads, according to the available data) and Abstracts Views on Vision4Press platform.
Data correspond to usage on the plateform after 2015. The current usage metrics is available 48-96 hours after online publication and is updated daily on week days.
Initial download of the metrics may take a while.