Fig. 7
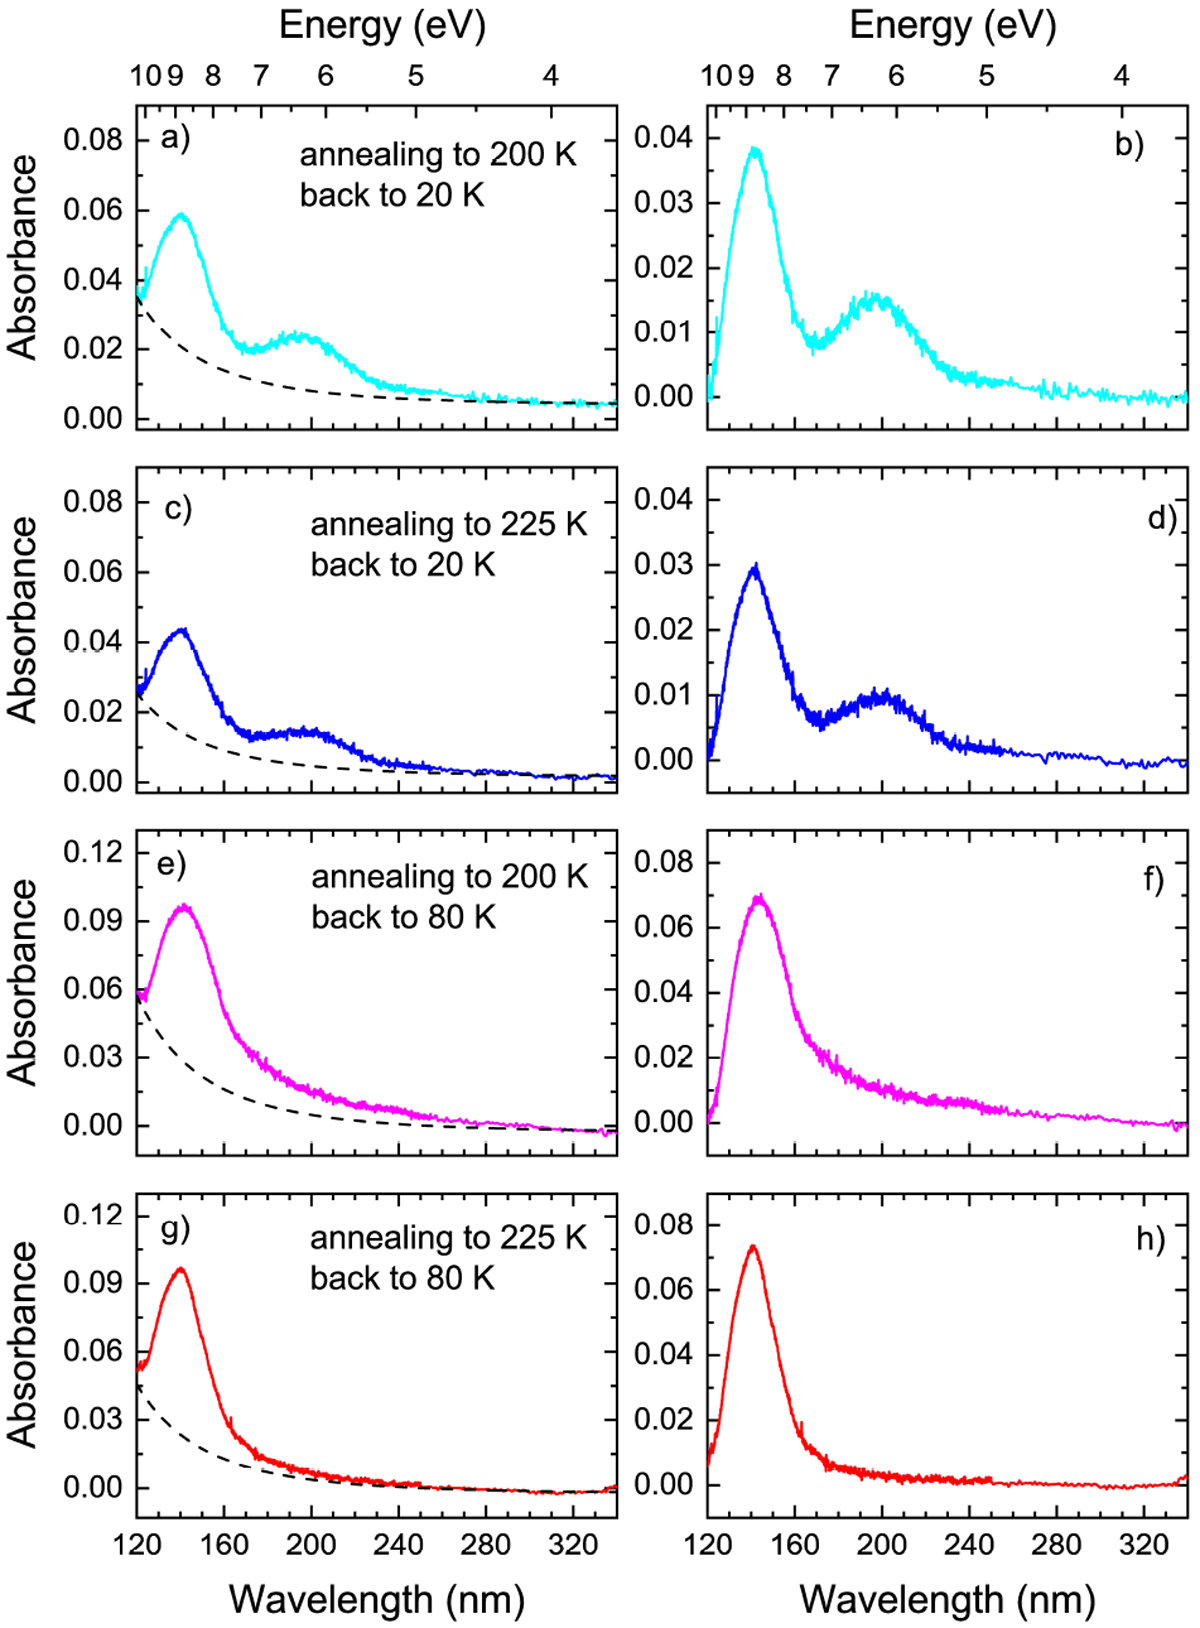
Left panels: VUV spectra of pure amorphous and crystalline H2CO3 ices at 20 and 80 K (solid lines) fitted with Eq. (11) (dashed black lines) to highlight the effect of Rayleigh scattering. Right panels: VUV spectra of pure amorphous and crystalline H2CO3 ices at20 and 80 K after fit subtraction to show real photoabsorption features of H2CO3 ice at 139 and 200 nm.
Current usage metrics show cumulative count of Article Views (full-text article views including HTML views, PDF and ePub downloads, according to the available data) and Abstracts Views on Vision4Press platform.
Data correspond to usage on the plateform after 2015. The current usage metrics is available 48-96 hours after online publication and is updated daily on week days.
Initial download of the metrics may take a while.