Fig. 5
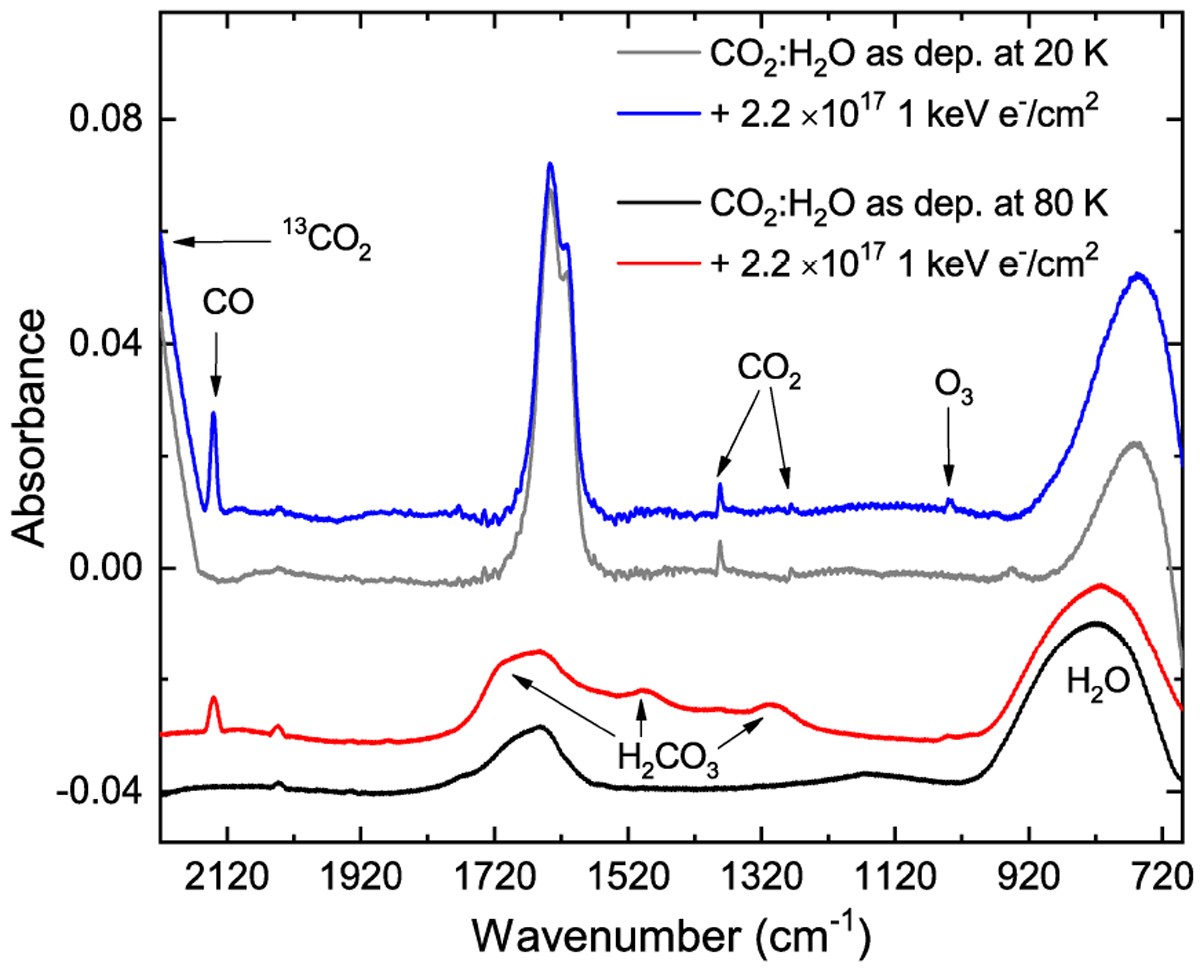
MIR (2220−690 cm−1) FT-IR spectra of CO2:H2O (6:1) ice mixtures deposited at 20 and 80 K before (solid gray at 20 K and black lines at 80 K) and after (solid blue at 20 K and red lines at 80 K) 1 keV electron irradiation with a total fluence of 2.2 × 10¹⁷ e− cm−2. The inset shows the difference spectra of the CO2:H2O (6:1) ice at 20 K after and before electron exposure.
Current usage metrics show cumulative count of Article Views (full-text article views including HTML views, PDF and ePub downloads, according to the available data) and Abstracts Views on Vision4Press platform.
Data correspond to usage on the plateform after 2015. The current usage metrics is available 48-96 hours after online publication and is updated daily on week days.
Initial download of the metrics may take a while.