Fig. A.1
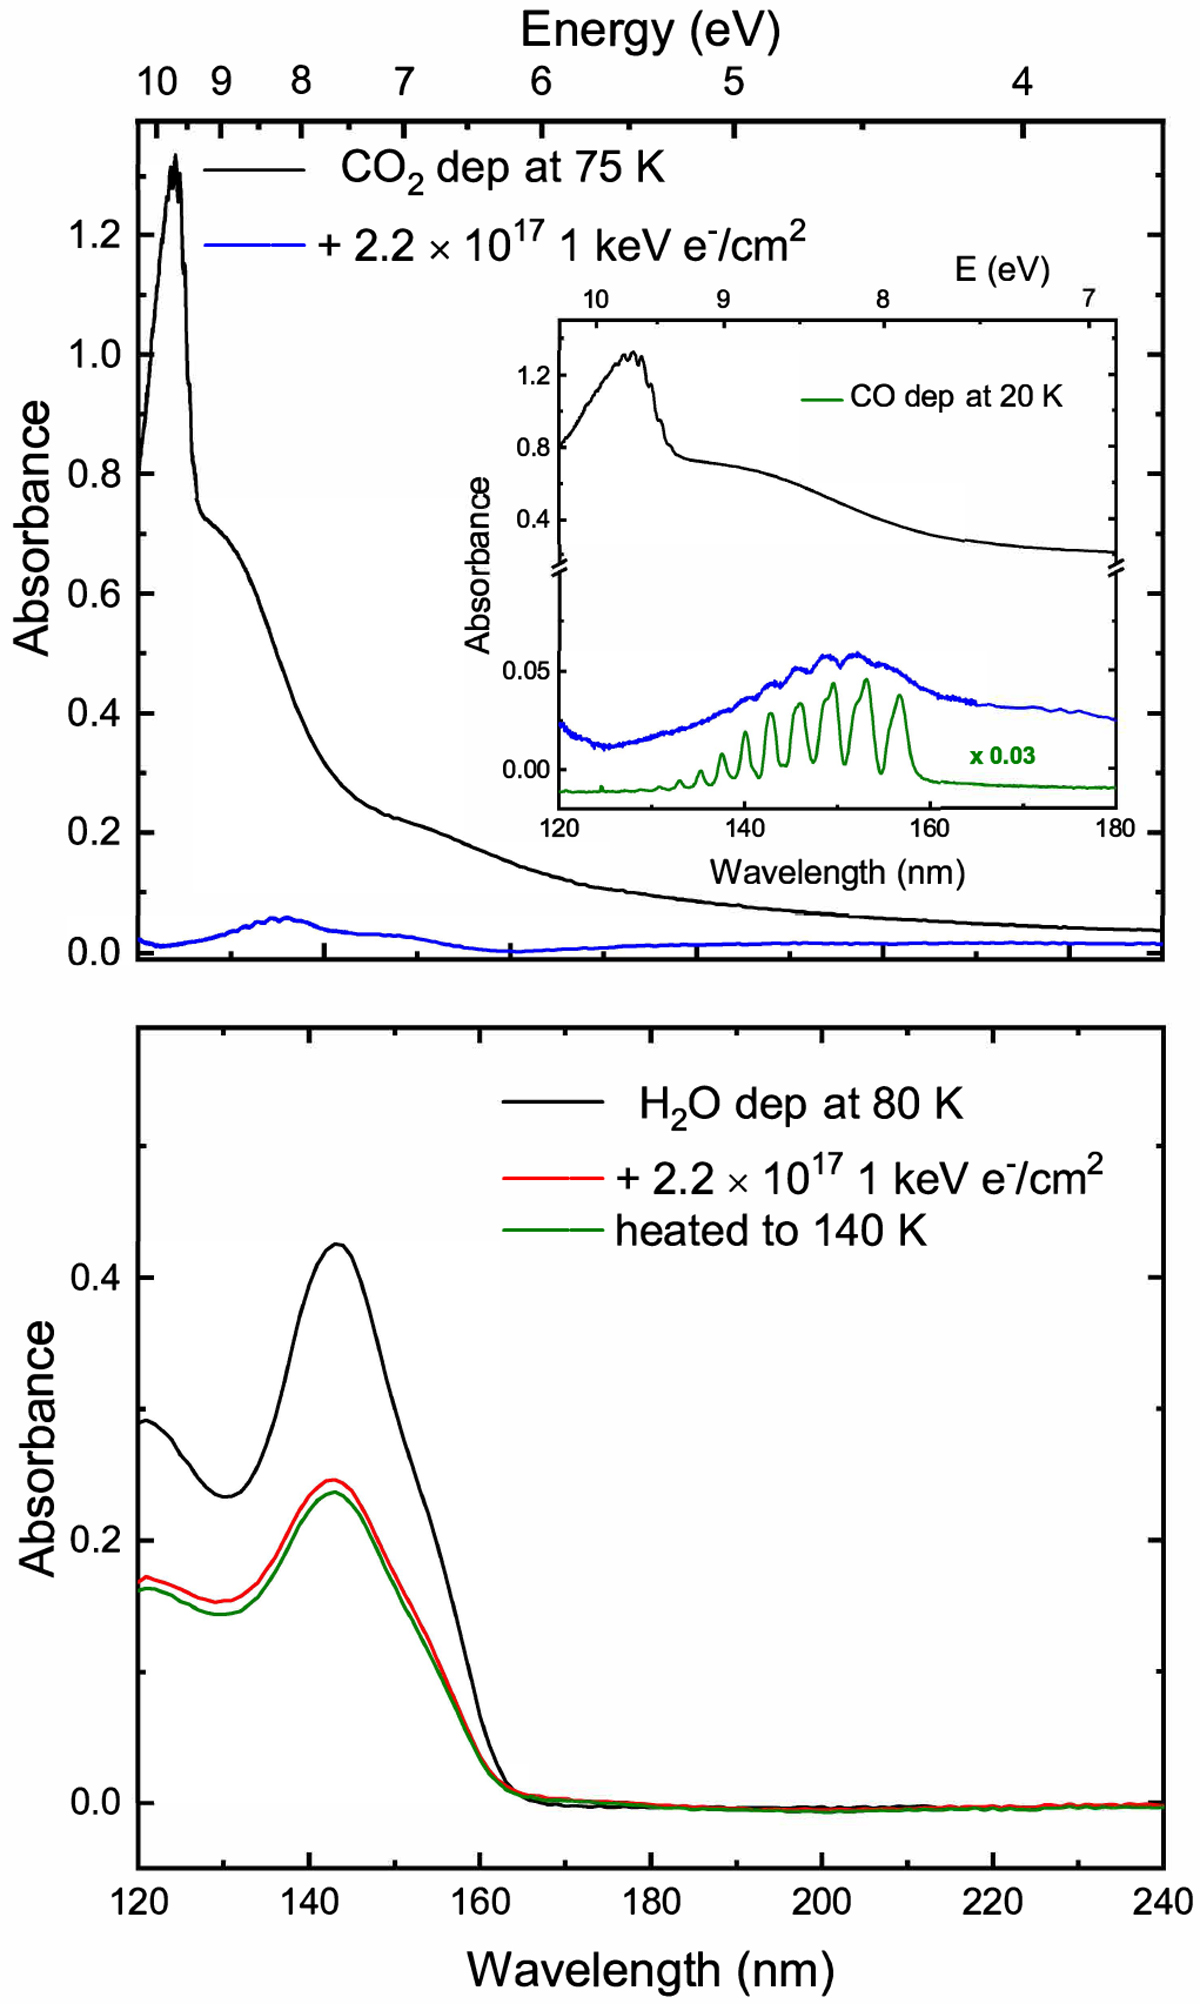
Top panel: VUV (120−340 nm) photoabsorption spectra of pure CO2 ices deposited at 75 K before and after (solid black and blue lines, respectively) 1 keV electron irradiation with a total fluence of 2.2 × 10¹⁷ e− cm−2 (i.e., a dose of 9.9 × 10² eV/16u). A VUV spectrum of pure CO ice is also displayed (solid green line). Bottom panel: VUV (120− 340 nm) photoabsorption spectra of pure H2O ices deposited at 80 K before and after (solid black and red lines, respectively) 1 keV electron irradiation with a maximum total fluence as for pure CO2 ice. The VUV photoabsorption spectrum of the processed ice heated to 140 K is also shown (solid green line).
Current usage metrics show cumulative count of Article Views (full-text article views including HTML views, PDF and ePub downloads, according to the available data) and Abstracts Views on Vision4Press platform.
Data correspond to usage on the plateform after 2015. The current usage metrics is available 48-96 hours after online publication and is updated daily on week days.
Initial download of the metrics may take a while.