Open Access
Fig. 8
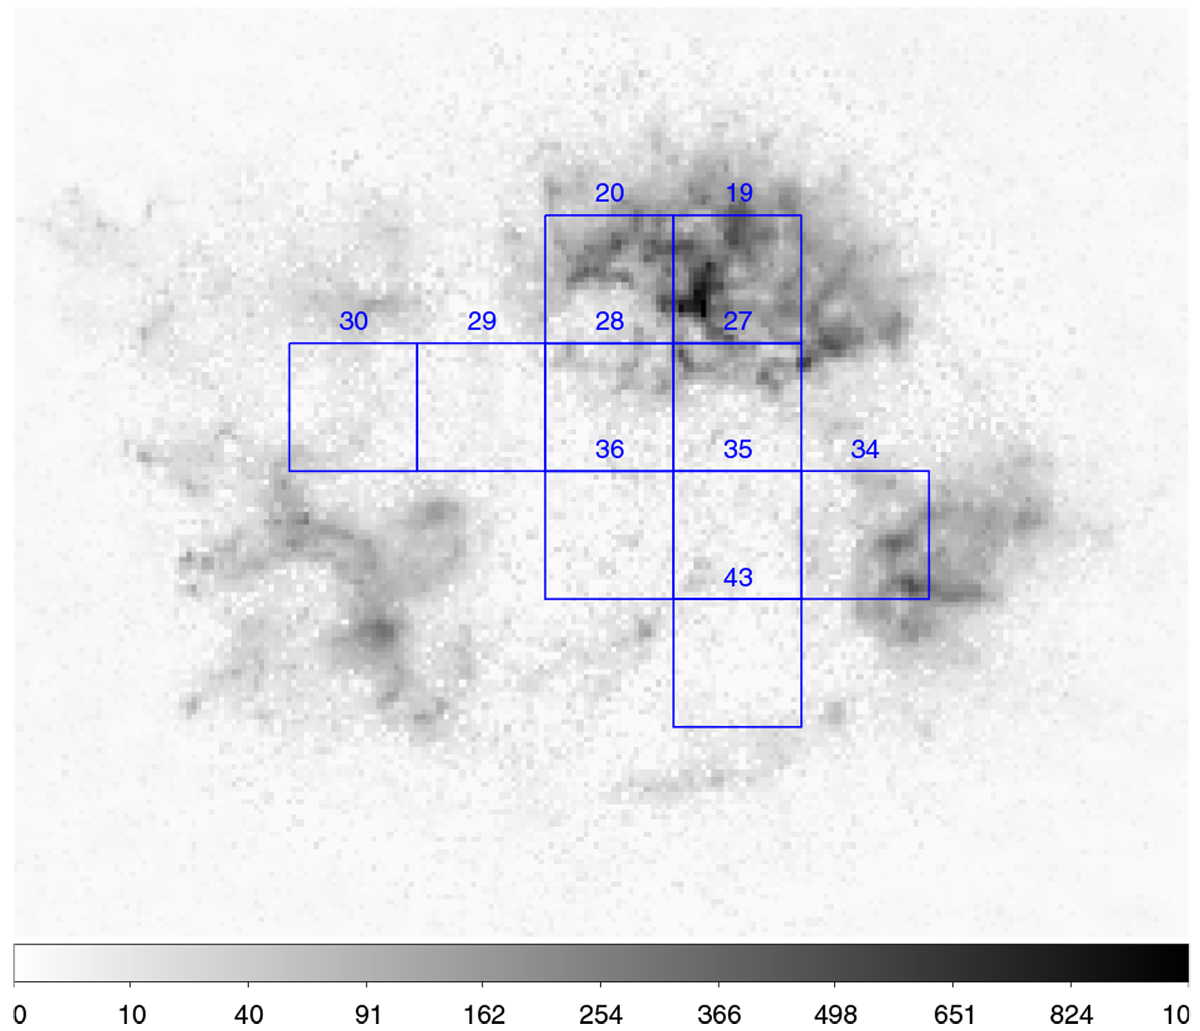
Counts image of the Fe-K red-shifted component overlaid with the extraction regions used for the 44Ti NuSTAR study of Grefenstette et al. (2017). The regions 19 and 20, which dominate our image in terms of flux, have respective velocities moving away from the observer of 2300 ± 1400 and 3200 ± 500 km sec−1.
Current usage metrics show cumulative count of Article Views (full-text article views including HTML views, PDF and ePub downloads, according to the available data) and Abstracts Views on Vision4Press platform.
Data correspond to usage on the plateform after 2015. The current usage metrics is available 48-96 hours after online publication and is updated daily on week days.
Initial download of the metrics may take a while.