Fig. 5
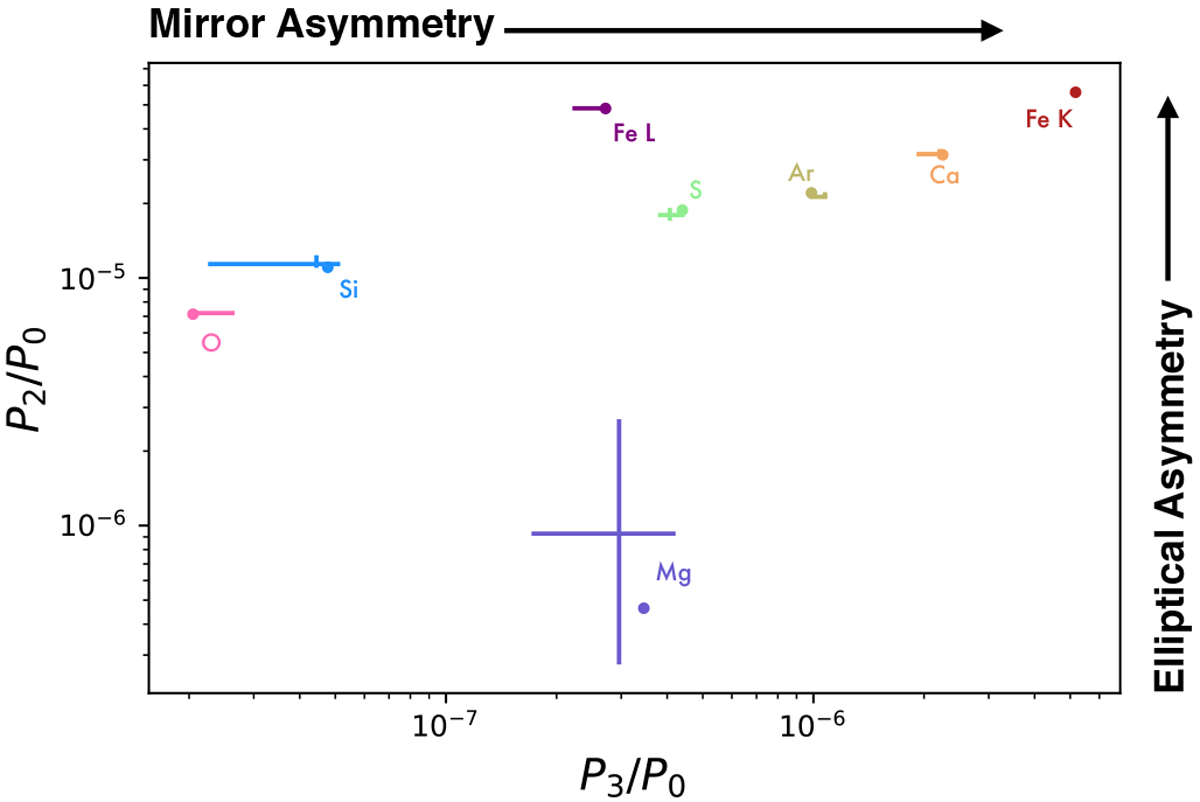
Quadrupole power-ratios P2∕P0 versus the octupole power-ratios P3∕P0 of the total images of the different line emissions shown in Fig. 2. The dots represent the values measured for the pGMCA images obtained from the real data, and the crosses the 10th and 90th percentiles obtained with pGMCA on a hundred constrained bootstrap resamplings, with the center of the cross being the median.
Current usage metrics show cumulative count of Article Views (full-text article views including HTML views, PDF and ePub downloads, according to the available data) and Abstracts Views on Vision4Press platform.
Data correspond to usage on the plateform after 2015. The current usage metrics is available 48-96 hours after online publication and is updated daily on week days.
Initial download of the metrics may take a while.