Fig. 4
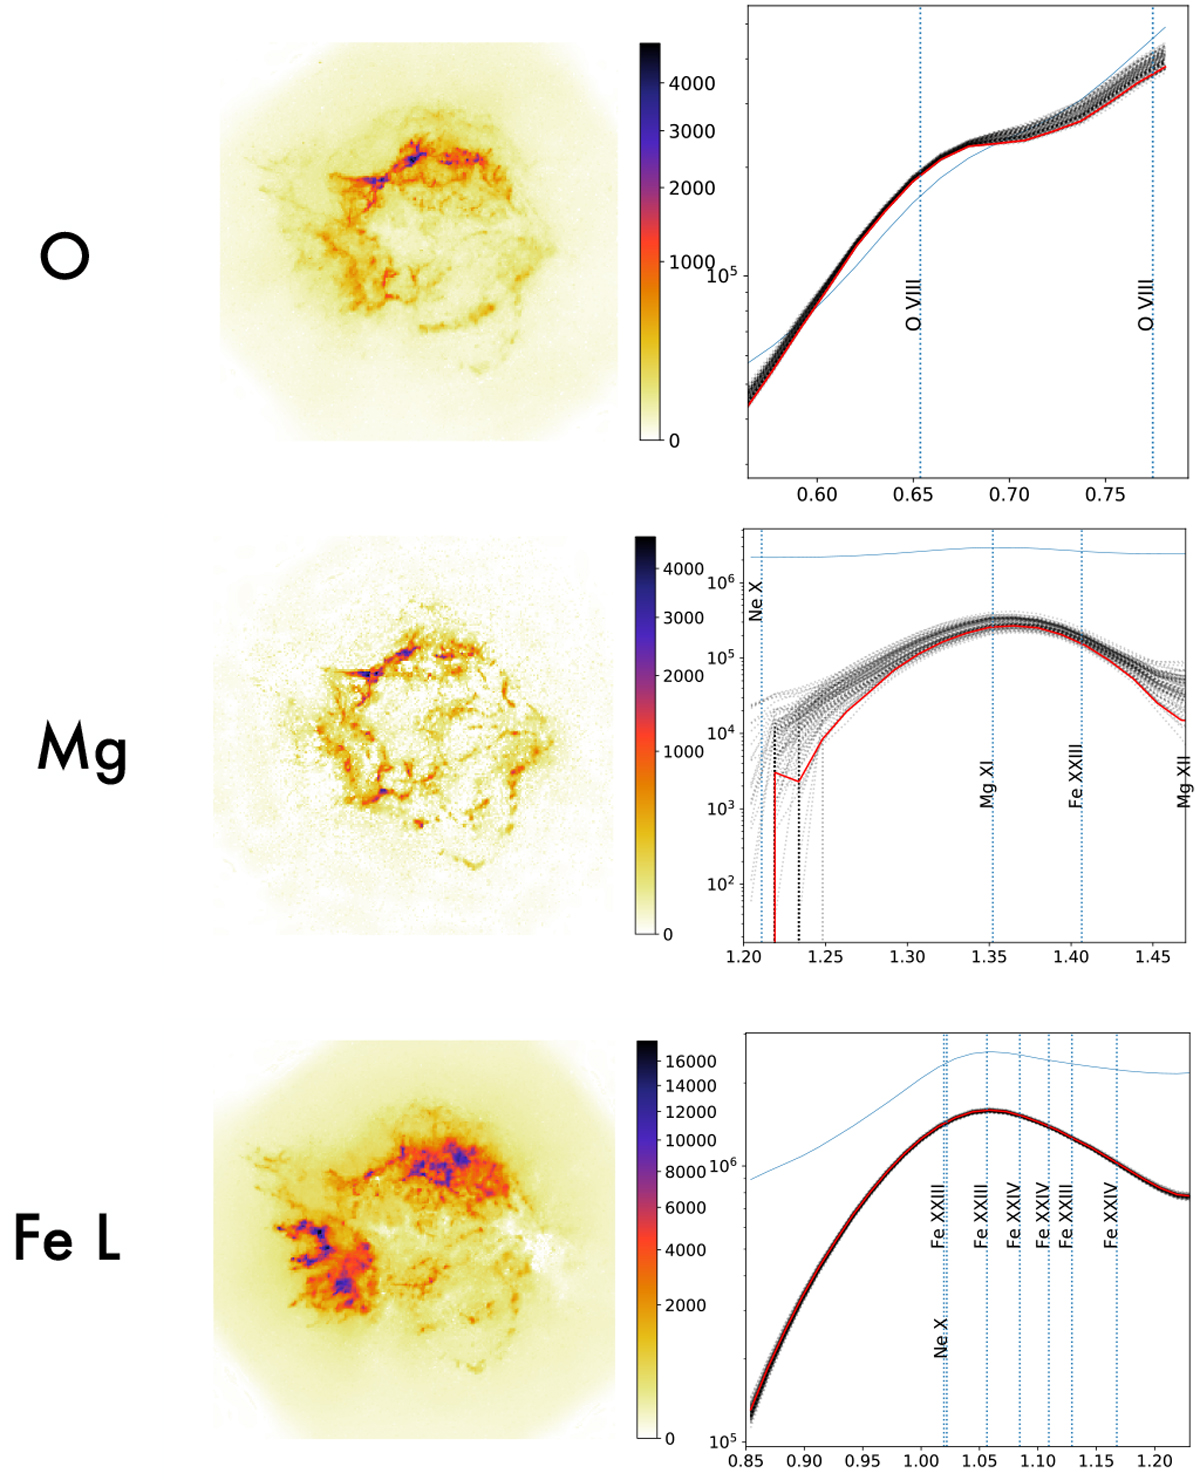
Images of the O, Mg, and Fe L line emission spatial structures and their associated spectra as found by pGMCA. The spectra in red correspond to the application of the algorithm on real data, while the dotted gray spectra correspond to the application on a hundred constrained bootstrap resamplings. The x-axis is in keV and the y-axis in counts.
Current usage metrics show cumulative count of Article Views (full-text article views including HTML views, PDF and ePub downloads, according to the available data) and Abstracts Views on Vision4Press platform.
Data correspond to usage on the plateform after 2015. The current usage metrics is available 48-96 hours after online publication and is updated daily on week days.
Initial download of the metrics may take a while.