Fig. 3
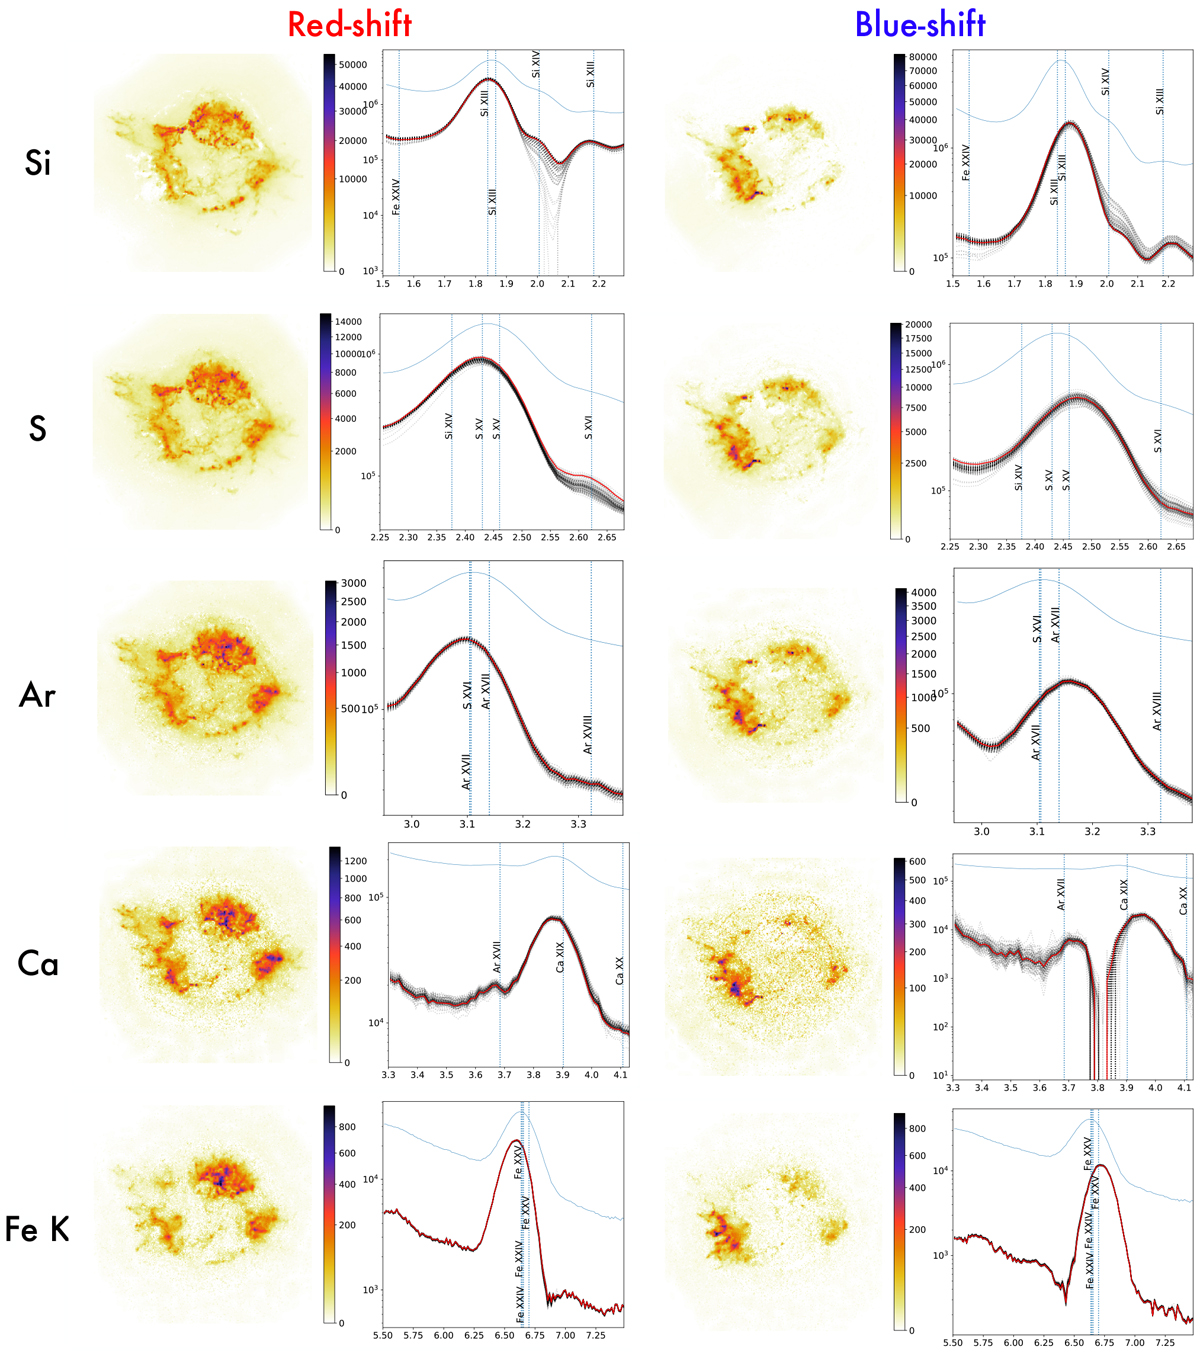
Red- and blue-shifted parts of the Si, S, Ar, Ca, and Fe line emission spatial distribution and their associated spectrum as found by pGMCA. The spectra in red correspond to the application of the algorithm on real data, while the dotted gray spectra correspond to the application on a hundred constrained bootstrap resamplings illustrating statistical uncertainties. The x-axis is in keV and the y-axis in counts. The dotted vertical lines represent the energy of the brightest emission lines for a non-equilibrium ionization plasma at a temperature of 1.5 keV and ionization timescale of log (τ) = 11.3 cm−3 s produced using the AtomDB (Foster et al. 2012). These parameters are the mean value of the distribution shown in Fig. 2 of Hwang & Laming (2012).
Current usage metrics show cumulative count of Article Views (full-text article views including HTML views, PDF and ePub downloads, according to the available data) and Abstracts Views on Vision4Press platform.
Data correspond to usage on the plateform after 2015. The current usage metrics is available 48-96 hours after online publication and is updated daily on week days.
Initial download of the metrics may take a while.