Open Access
Fig. 2
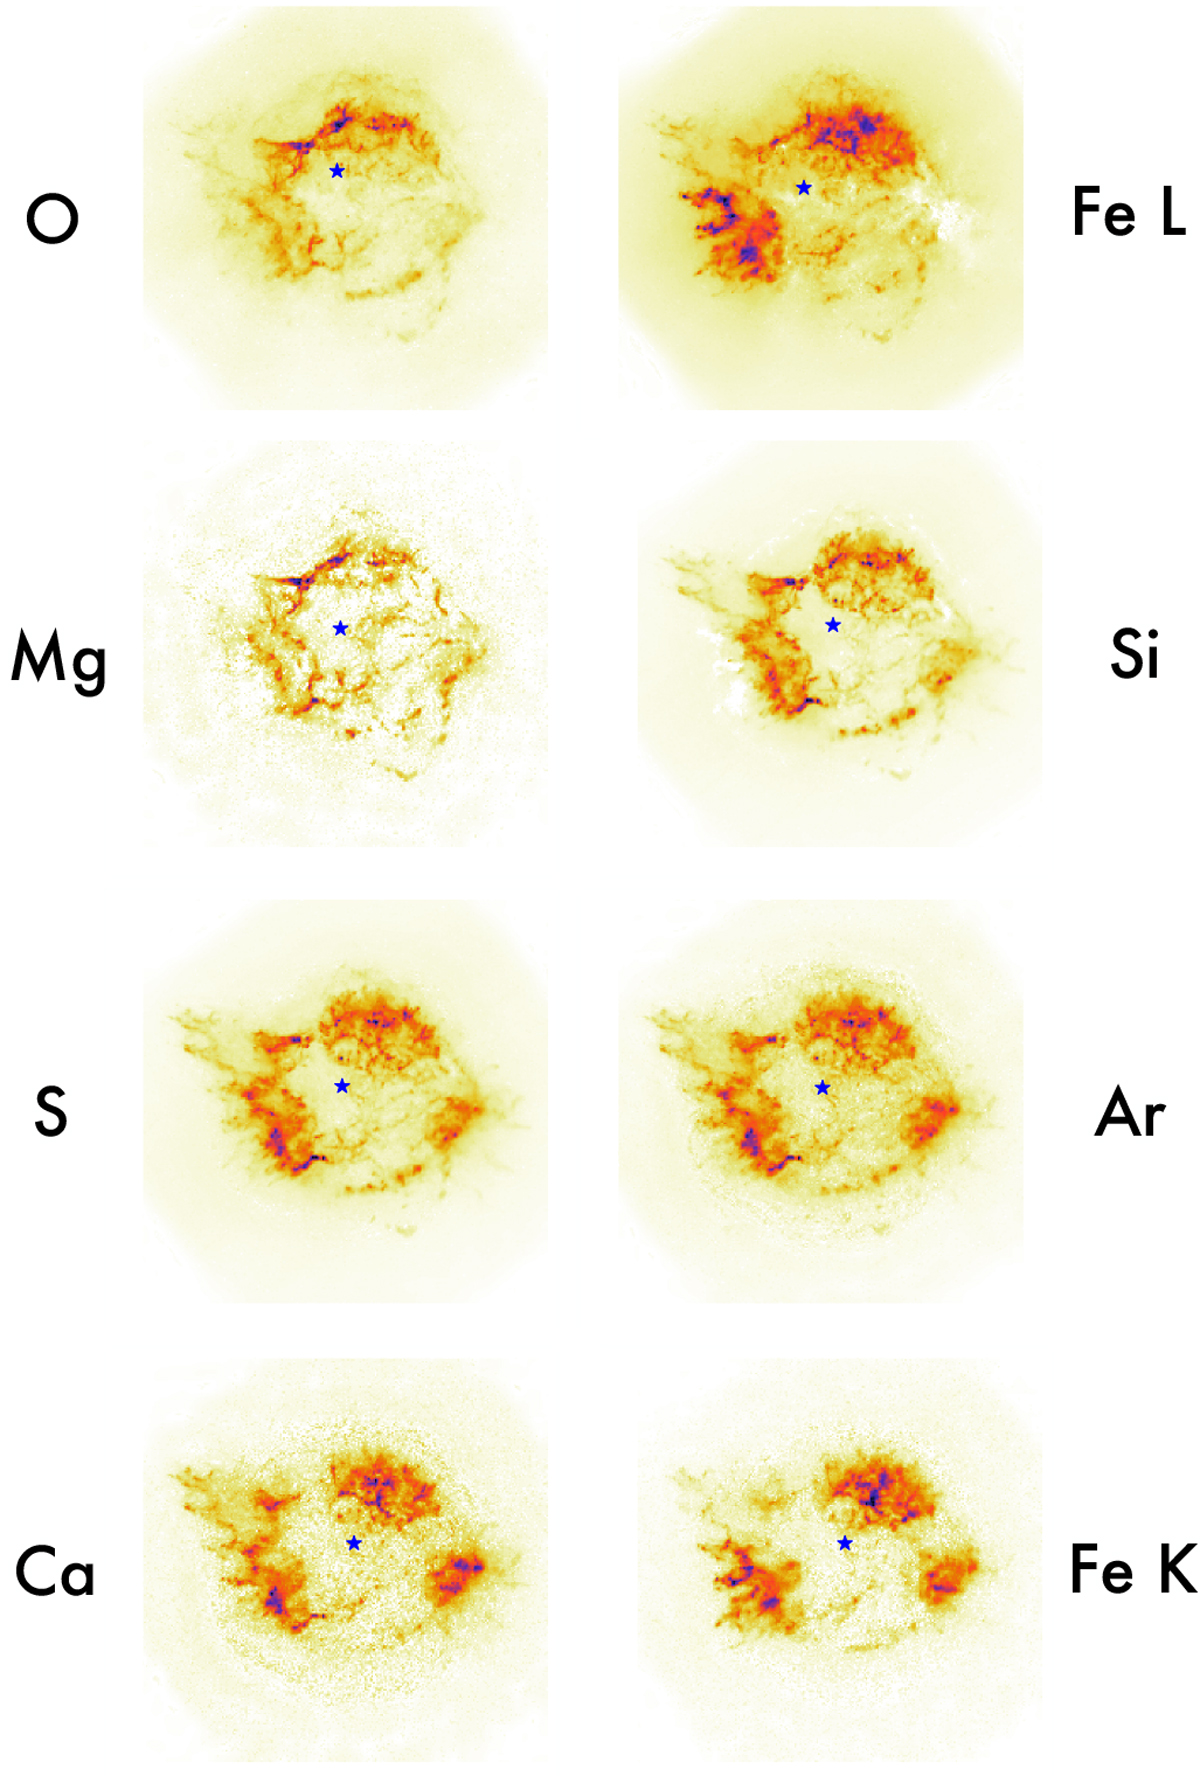
Total images of the different line emission spatial structure as retrieved by the pGMCA. The blue symbol represents the image centroid adopted in the PRM analysis. The color-scale is in square root.
Current usage metrics show cumulative count of Article Views (full-text article views including HTML views, PDF and ePub downloads, according to the available data) and Abstracts Views on Vision4Press platform.
Data correspond to usage on the plateform after 2015. The current usage metrics is available 48-96 hours after online publication and is updated daily on week days.
Initial download of the metrics may take a while.