Fig. B.5
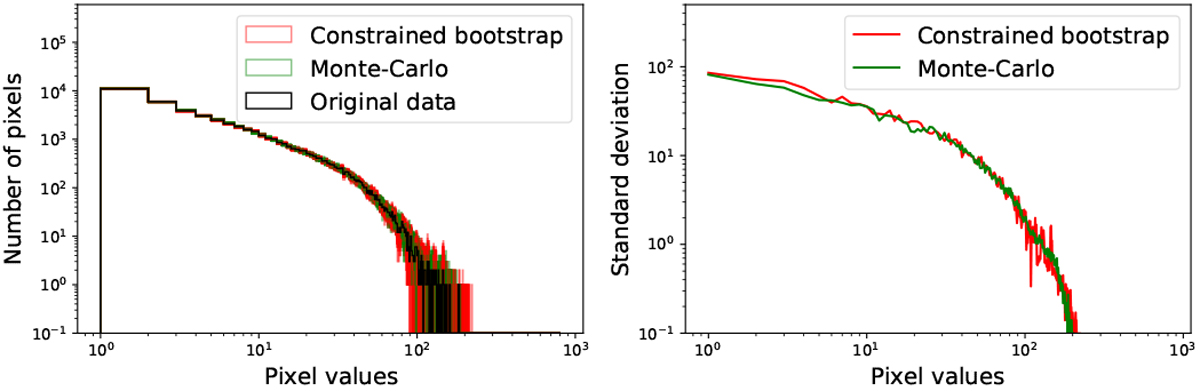
Histograms and standard deviations of the original and resampled data sets. On the left, histograms of the original data, the resampled data sets and the MC realizations of the toy model Cas A image. On the right, the standard deviations of the resampled data sets and MC realizations bin by bin of the histogram on the left. We can notice the great adequation between the standard deviations of the resampled data sets and that of the MC realizations.
Current usage metrics show cumulative count of Article Views (full-text article views including HTML views, PDF and ePub downloads, according to the available data) and Abstracts Views on Vision4Press platform.
Data correspond to usage on the plateform after 2015. The current usage metrics is available 48-96 hours after online publication and is updated daily on week days.
Initial download of the metrics may take a while.