Fig. B.2
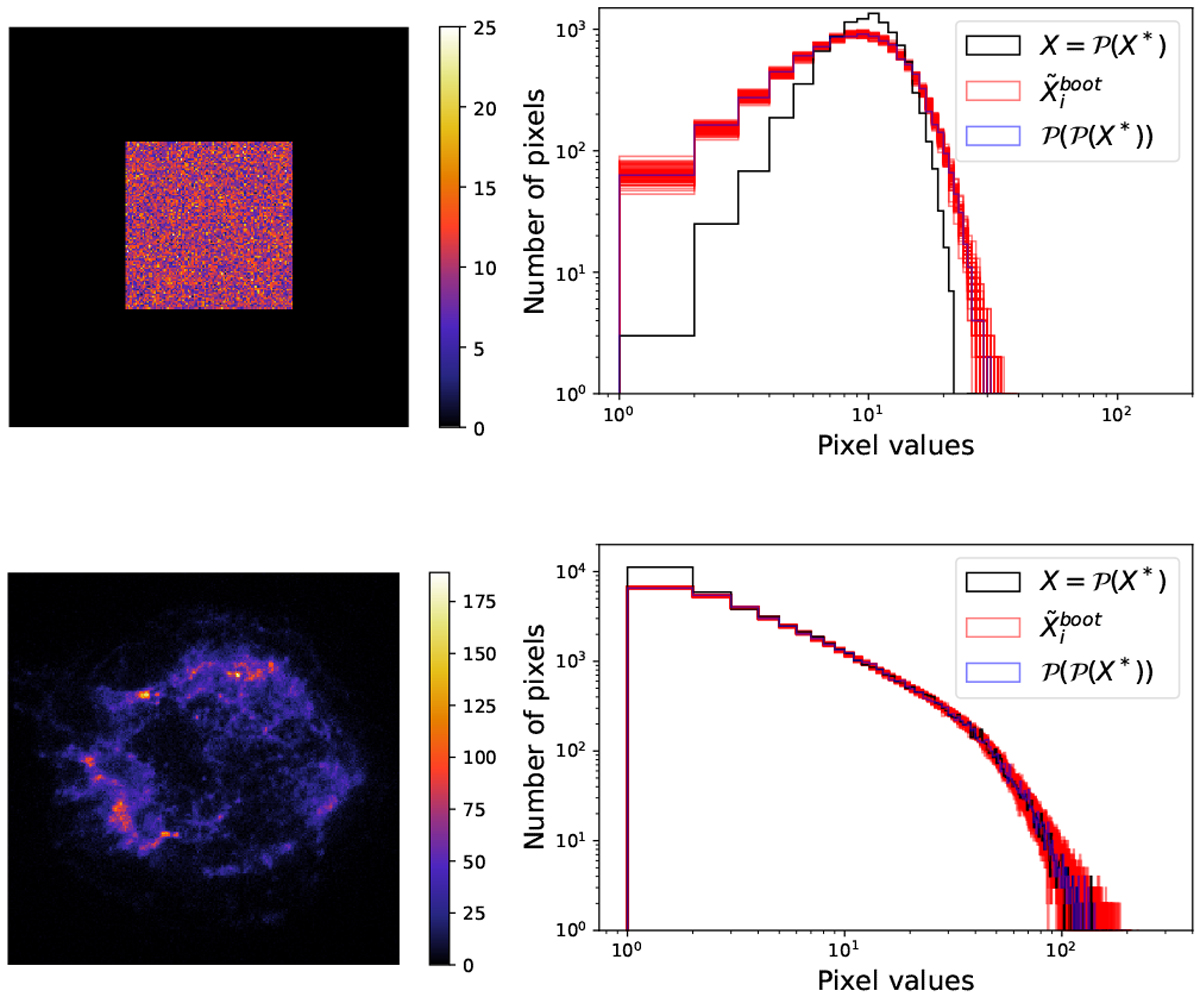
Data sets and their associated histogram in two cases: on top, the very simple case of a Poisson realization of the image of a square with uniform value 10; on the bottom, a toy model Cas A image obtained by taking a Poisson realization of a high-statistics denoised image of Cas A (hereafter called toy model). On the right, the black histogram correspond to the original data
![]() . The red histograms are those of the data sets
. The red histograms are those of the data sets ![]() obtained through resampling of the original data and the blue ones are the histograms of a Poisson realization of the original data
obtained through resampling of the original data and the blue ones are the histograms of a Poisson realization of the original data![]() . It appears that the resampled data sets have histograms highly similar to that of the original data with additional Poisson noise.
. It appears that the resampled data sets have histograms highly similar to that of the original data with additional Poisson noise.
Current usage metrics show cumulative count of Article Views (full-text article views including HTML views, PDF and ePub downloads, according to the available data) and Abstracts Views on Vision4Press platform.
Data correspond to usage on the plateform after 2015. The current usage metrics is available 48-96 hours after online publication and is updated daily on week days.
Initial download of the metrics may take a while.