Fig. 8.
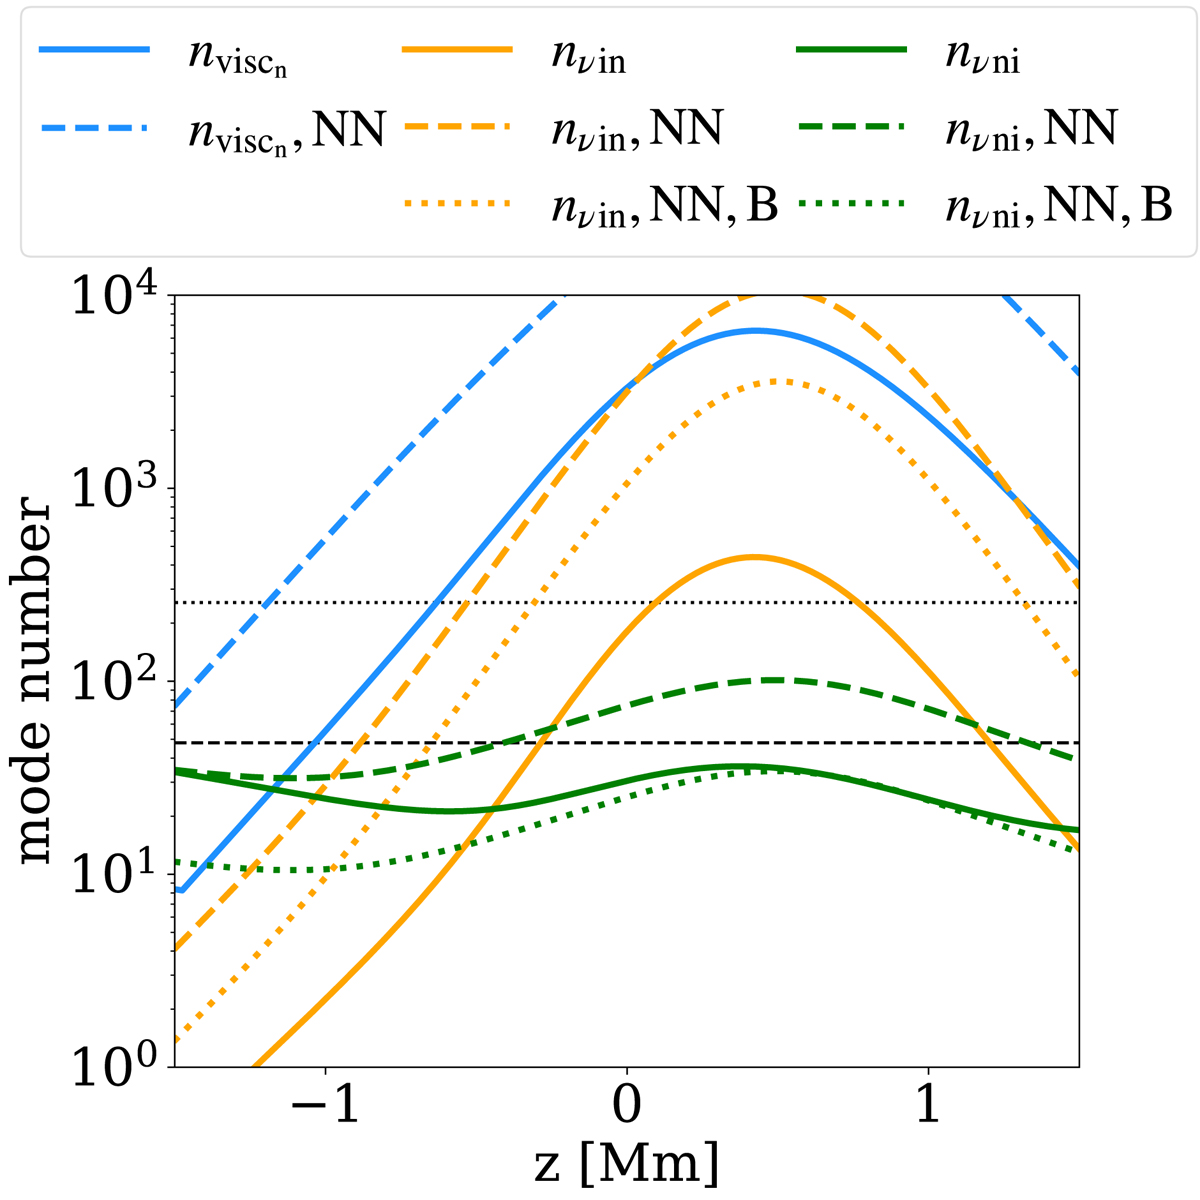
Modes corresponding to the neutral viscosity (blue lines), ion-neutral collision scale (orange lines), and neutral-ion collision scale (green lines) as a function of height, computed for the original density profile (solid lines), for the enhanced density profile (dashed lines), and for the enhanced density and magnetic field profiles (dotted lines), from Eqs. (33)–(34). The horizontal dashed line marks the maximum mode number shown in Fig. 5, n = 48, and the dotted line represents the largest mode number that can be resolved in the domain, using two points, n = 256.
Current usage metrics show cumulative count of Article Views (full-text article views including HTML views, PDF and ePub downloads, according to the available data) and Abstracts Views on Vision4Press platform.
Data correspond to usage on the plateform after 2015. The current usage metrics is available 48-96 hours after online publication and is updated daily on week days.
Initial download of the metrics may take a while.