Fig. 4.
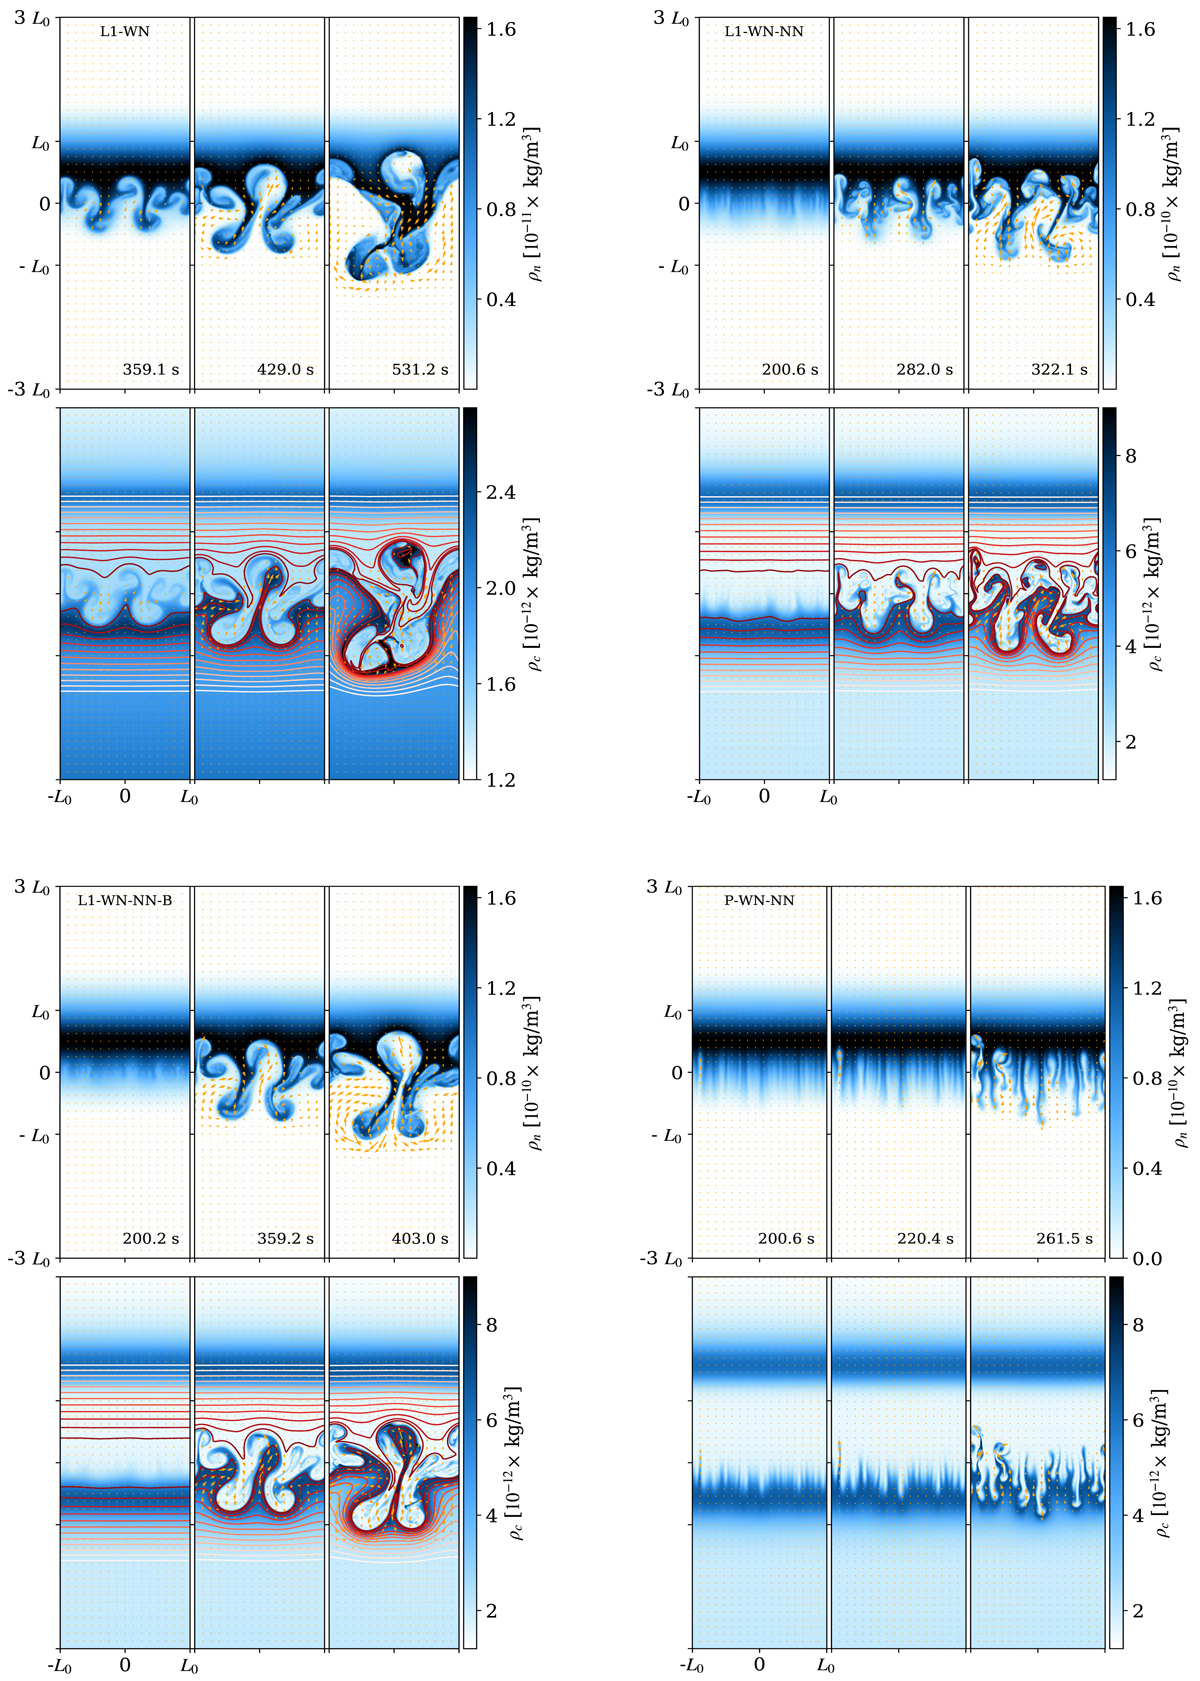
Time series of the snapshots of neutral and charged densities for the simulations L1-WN (top left group of panels), L1-WN-NN (top right group of panels), L1-WN-NN-B (bottom left group of panels), P-WN-NN (bottom right group of panels). The in plane (x and z components) velocities of neutrals and charged particles are represented by orange arrows in the plots which show the densities of neutrals and charged particles, respectively. For the simulations with sheared magnetic field (L1-WN, L1-WN-NN, L1-WN-NN-B), the iso-contours of the absolute value of the y-component of the magnetic field potential, |Ay|, are shown at the bottom panels. The iso-contours are equally spaced between 0.6 ![]() and
and ![]() , where
, where ![]() is the maximum value of |Ay|.
is the maximum value of |Ay|.
Current usage metrics show cumulative count of Article Views (full-text article views including HTML views, PDF and ePub downloads, according to the available data) and Abstracts Views on Vision4Press platform.
Data correspond to usage on the plateform after 2015. The current usage metrics is available 48-96 hours after online publication and is updated daily on week days.
Initial download of the metrics may take a while.