Fig. 13.
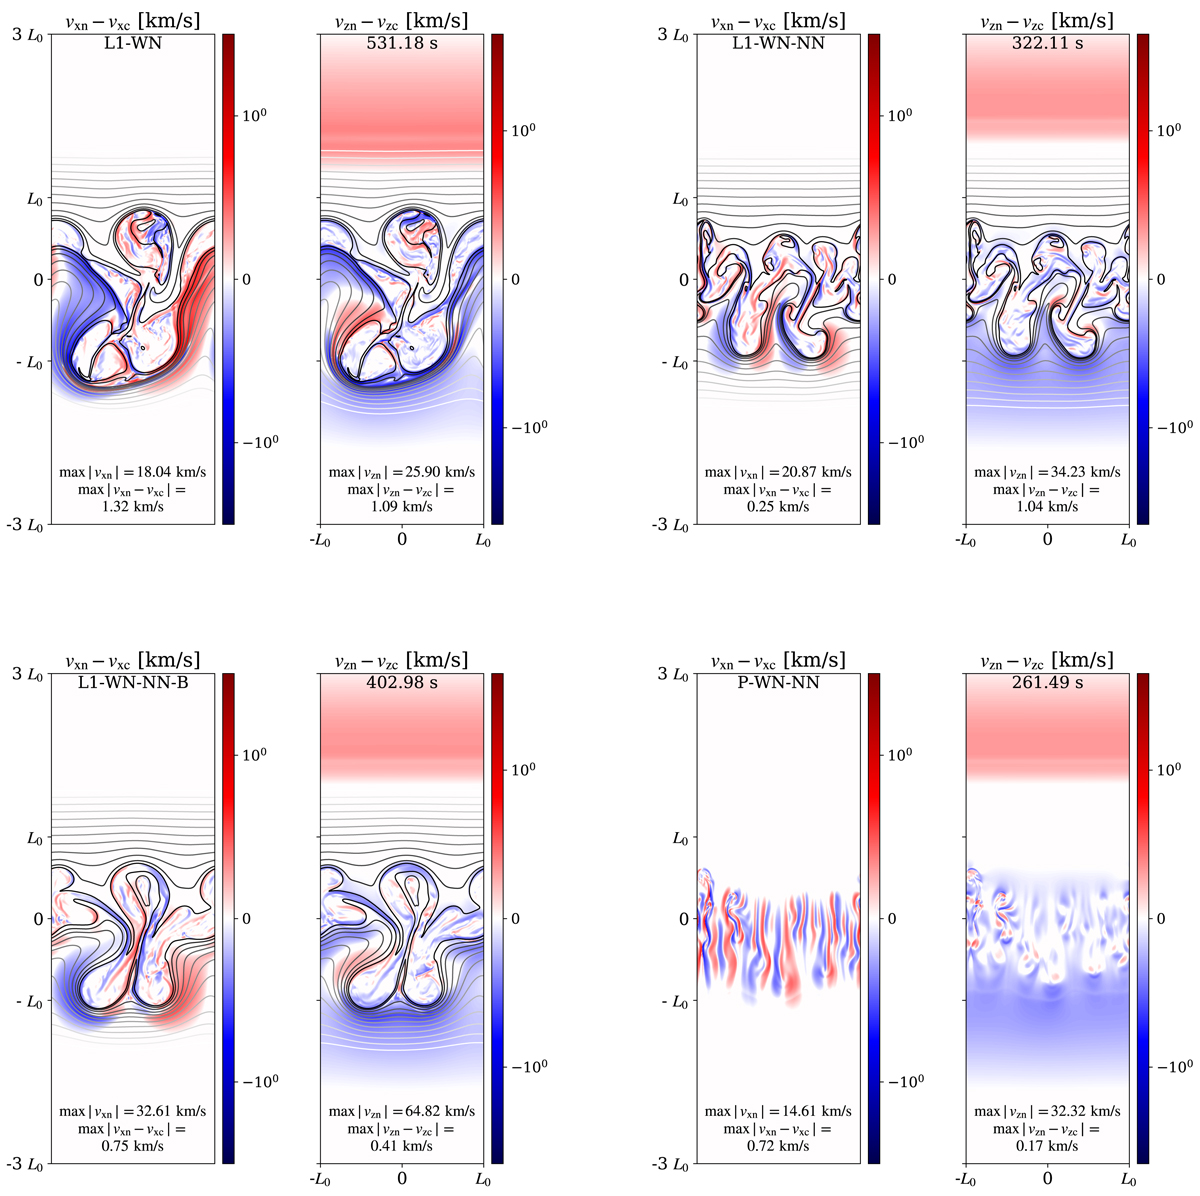
Pairs of snapshots of the horizontal and vertical decoupling in velocities for the simulations P-WN (top left), P-WN-NN (top right), L1-WN-NN-B (bottom left), and P-WN-NN (bottom right). The snapshots are taken at the time indicated at the right-hand-side image of each pair. The maximum absolute values of the corresponding decoupling and velocity are indicated at the bottom of each image. The black lines represent the iso-contours of the absolute value of the y-component of the magnetic field potential, |Ay|. The iso-contours are equally spaced between 0.6 ![]() and
and ![]() , where
, where ![]() is the maximum value of |Ay|.
is the maximum value of |Ay|.
Current usage metrics show cumulative count of Article Views (full-text article views including HTML views, PDF and ePub downloads, according to the available data) and Abstracts Views on Vision4Press platform.
Data correspond to usage on the plateform after 2015. The current usage metrics is available 48-96 hours after online publication and is updated daily on week days.
Initial download of the metrics may take a while.