Fig. 11.
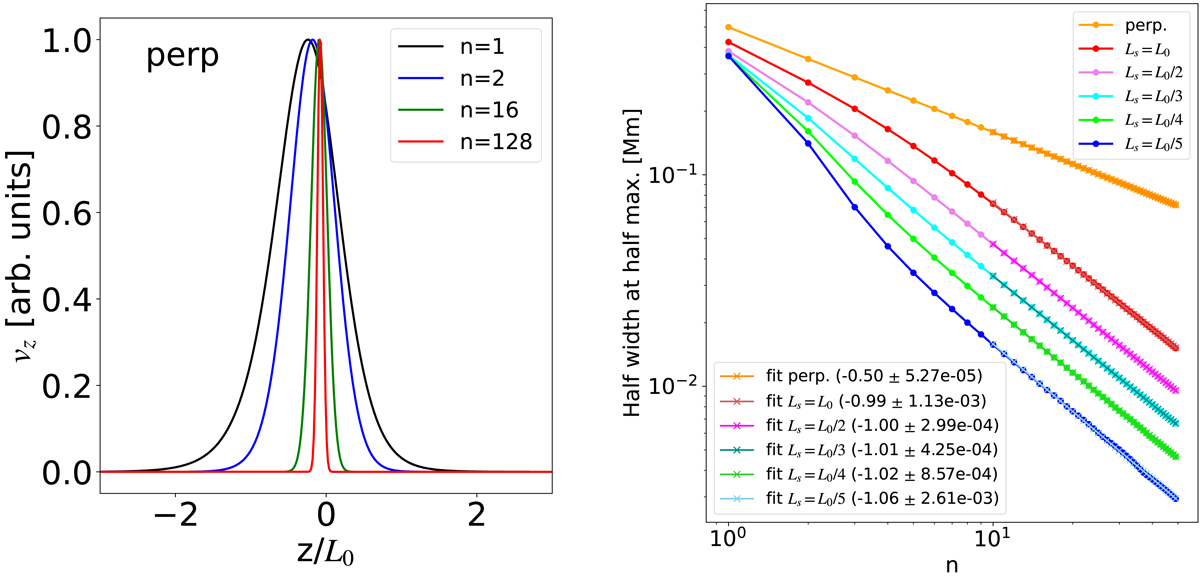
Left: eigenfunctions corresponding to the largest growth rates for the modes n = 1 (black line), n = 2 (blue line), n = 16 (green line), and n = 128 (red line), normalized to unity, as a function of height for the perpendicular magnetic field configuration. Right: Log–log plot of half width at half maximum, Δ, of the eigenfunctions as a function of the mode number n for the range 1 ≤ n ≤ 50 for different configurations of the magnetic field: perpendicular (orange), sheared with shear length equal to: L0 (red), L0/2 (violet), L0/3 (cyan), L0/4 (lime), L0/5 (blue). The slopes of the curves calculated from a linear fit for the modes 10 ≤ n ≤ 50 and the uncertainties of the fit are indicated in the legend.
Current usage metrics show cumulative count of Article Views (full-text article views including HTML views, PDF and ePub downloads, according to the available data) and Abstracts Views on Vision4Press platform.
Data correspond to usage on the plateform after 2015. The current usage metrics is available 48-96 hours after online publication and is updated daily on week days.
Initial download of the metrics may take a while.