Fig. 10.
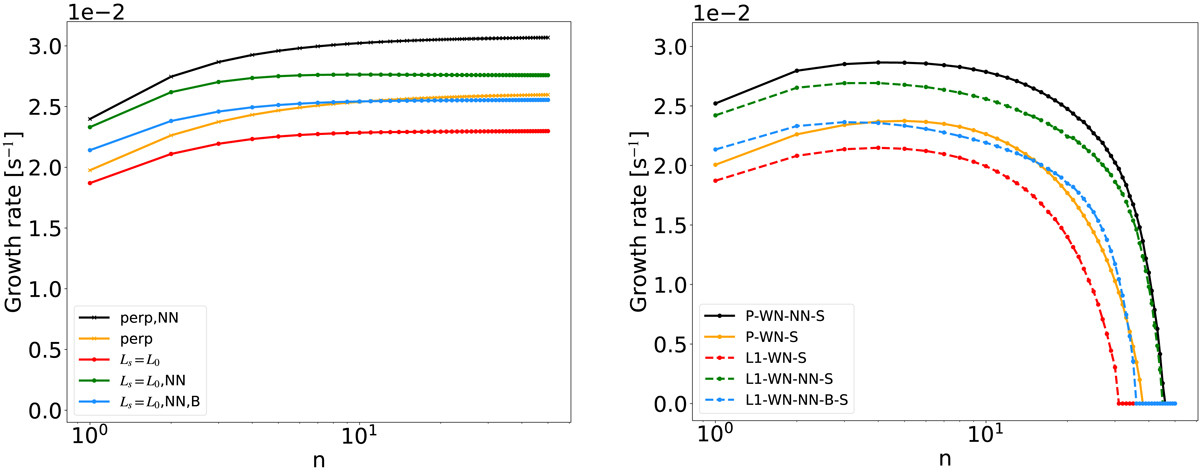
Comparison between the growth rates obtained semi-analytically in the incompressible MHD approximation (left) and the growth rates obtained from simulations (right) and as functions of the mode number, n, in logarithmic scale, limited to n = 50. In both panels, the perpendicular magnetic field cases are shown with solid lines and sheared case are shown with dashed lines. Orange lines: P-WN-S; black lines: P-WN-NN-S; red lines: L1-WN-S; green lines: L1-WN-NN-S, and blue lines for L1-WN-NN-B-S.
Current usage metrics show cumulative count of Article Views (full-text article views including HTML views, PDF and ePub downloads, according to the available data) and Abstracts Views on Vision4Press platform.
Data correspond to usage on the plateform after 2015. The current usage metrics is available 48-96 hours after online publication and is updated daily on week days.
Initial download of the metrics may take a while.