Free Access
Fig. 2.
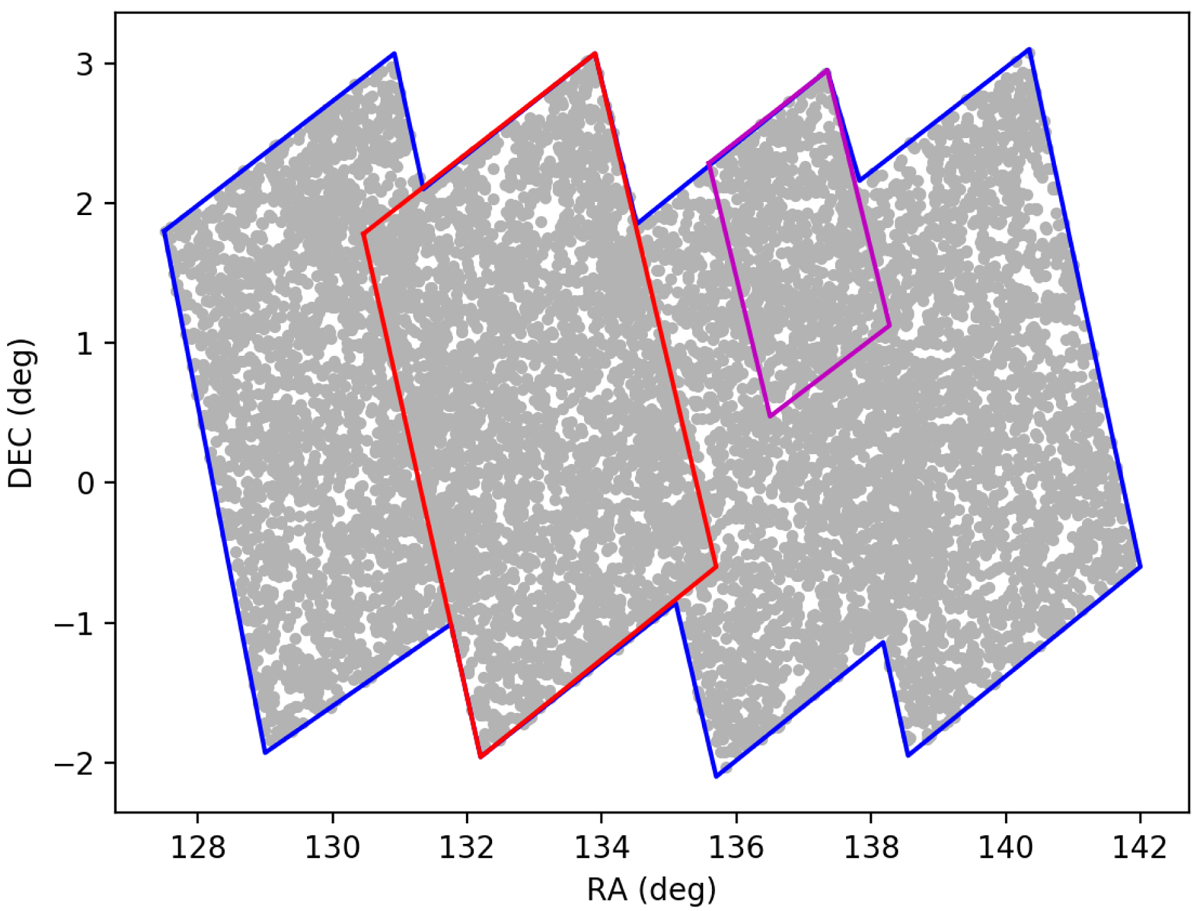
Examples of the different area selection to measure the cross-correlation function for the G09 H-ATLAS field. The All field area is shown in blue (56 sq. deg). The Tile selection is shown in red (4 × 4 sq. deg) and the mini-Tile area in magenta (2 × 2 sq. deg).
Current usage metrics show cumulative count of Article Views (full-text article views including HTML views, PDF and ePub downloads, according to the available data) and Abstracts Views on Vision4Press platform.
Data correspond to usage on the plateform after 2015. The current usage metrics is available 48-96 hours after online publication and is updated daily on week days.
Initial download of the metrics may take a while.