Fig. 9.
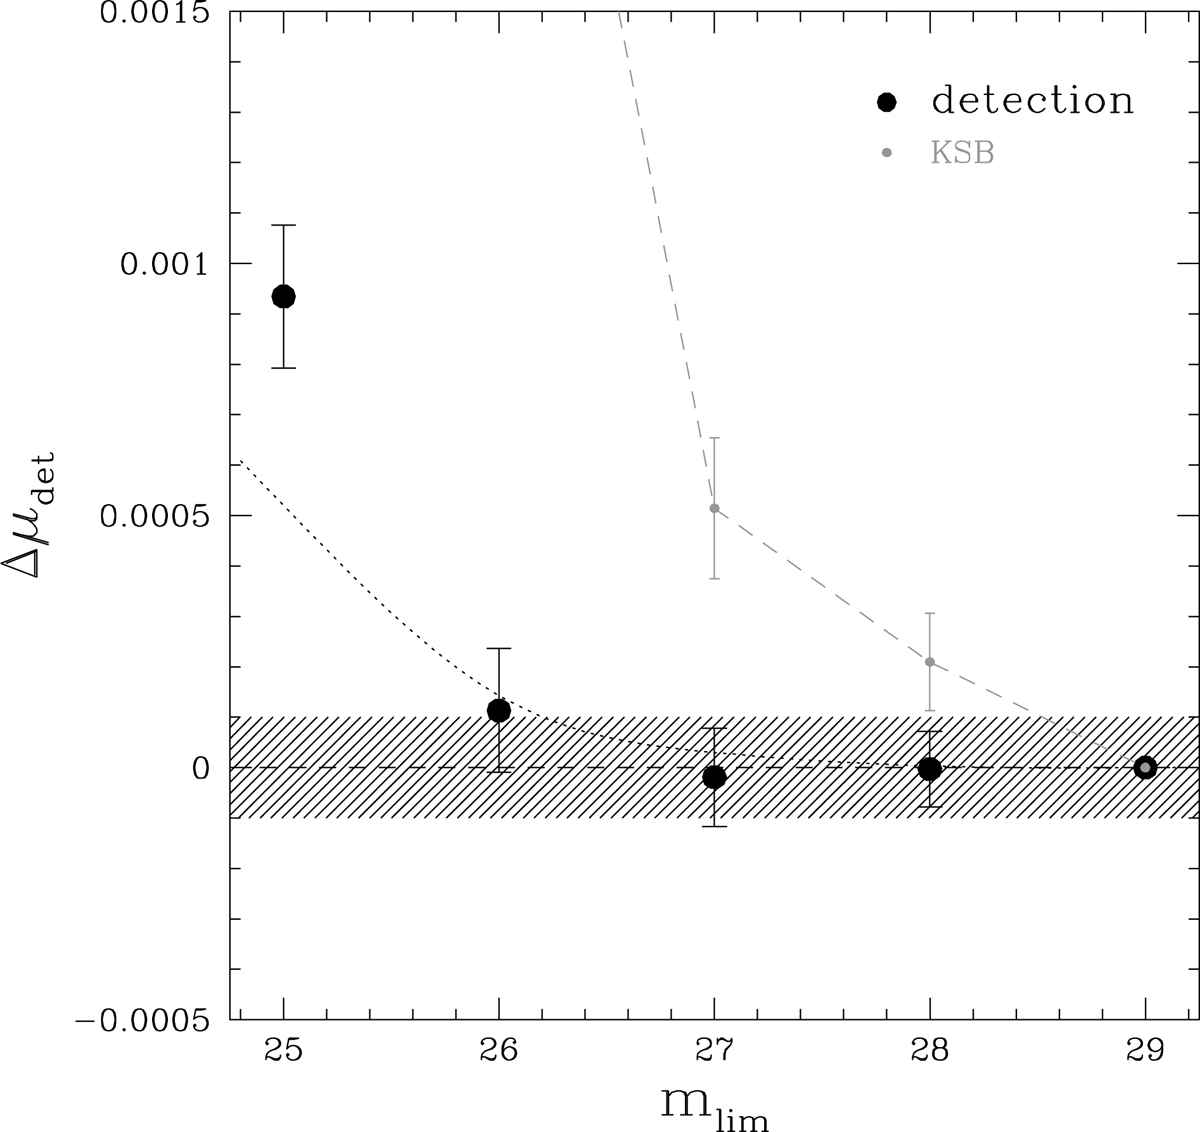
Change in multiplicative detection bias Δμdet (with respect to μ(mlim = 29)) for galaxies with 20 < mAUTO < 24.5 as a function of mlim, the magnitude of the faintest galaxies that are included in the simulation (black points). The dotted line shows the change in bias if we select galaxies based on their input magnitude (20 < minput < 24.5). The change in multiplicative bias for the KSB algorithm is indicated by the light grey points. The hatched region indicates a tolerance of 10−4.
Current usage metrics show cumulative count of Article Views (full-text article views including HTML views, PDF and ePub downloads, according to the available data) and Abstracts Views on Vision4Press platform.
Data correspond to usage on the plateform after 2015. The current usage metrics is available 48-96 hours after online publication and is updated daily on week days.
Initial download of the metrics may take a while.