Fig. 7.
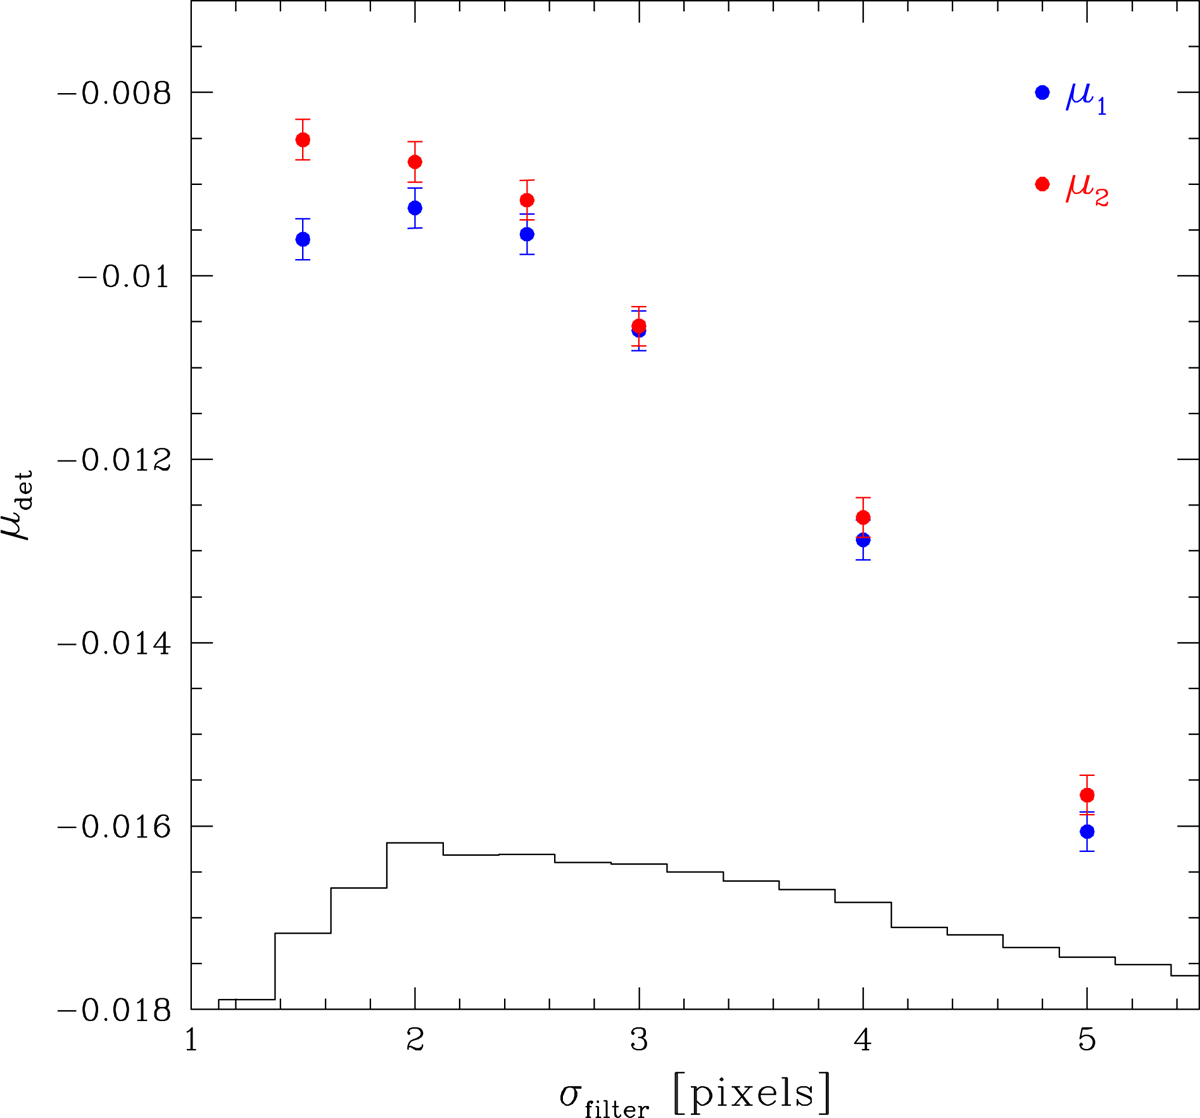
Multiplicative detection bias μdet as a function of the width of the filter used in the detection step for galaxies with 20 < mAUTO < 24.5. The blue (red) points correspond to μ1 (μ2). The histogram shows the distribution of corresponding sizes based on the half-light radius of the galaxies, suggesting that a width of 2 − 3 pixels is best. The bias increases quickly for larger values of σfilter.
Current usage metrics show cumulative count of Article Views (full-text article views including HTML views, PDF and ePub downloads, according to the available data) and Abstracts Views on Vision4Press platform.
Data correspond to usage on the plateform after 2015. The current usage metrics is available 48-96 hours after online publication and is updated daily on week days.
Initial download of the metrics may take a while.