Fig. 6.
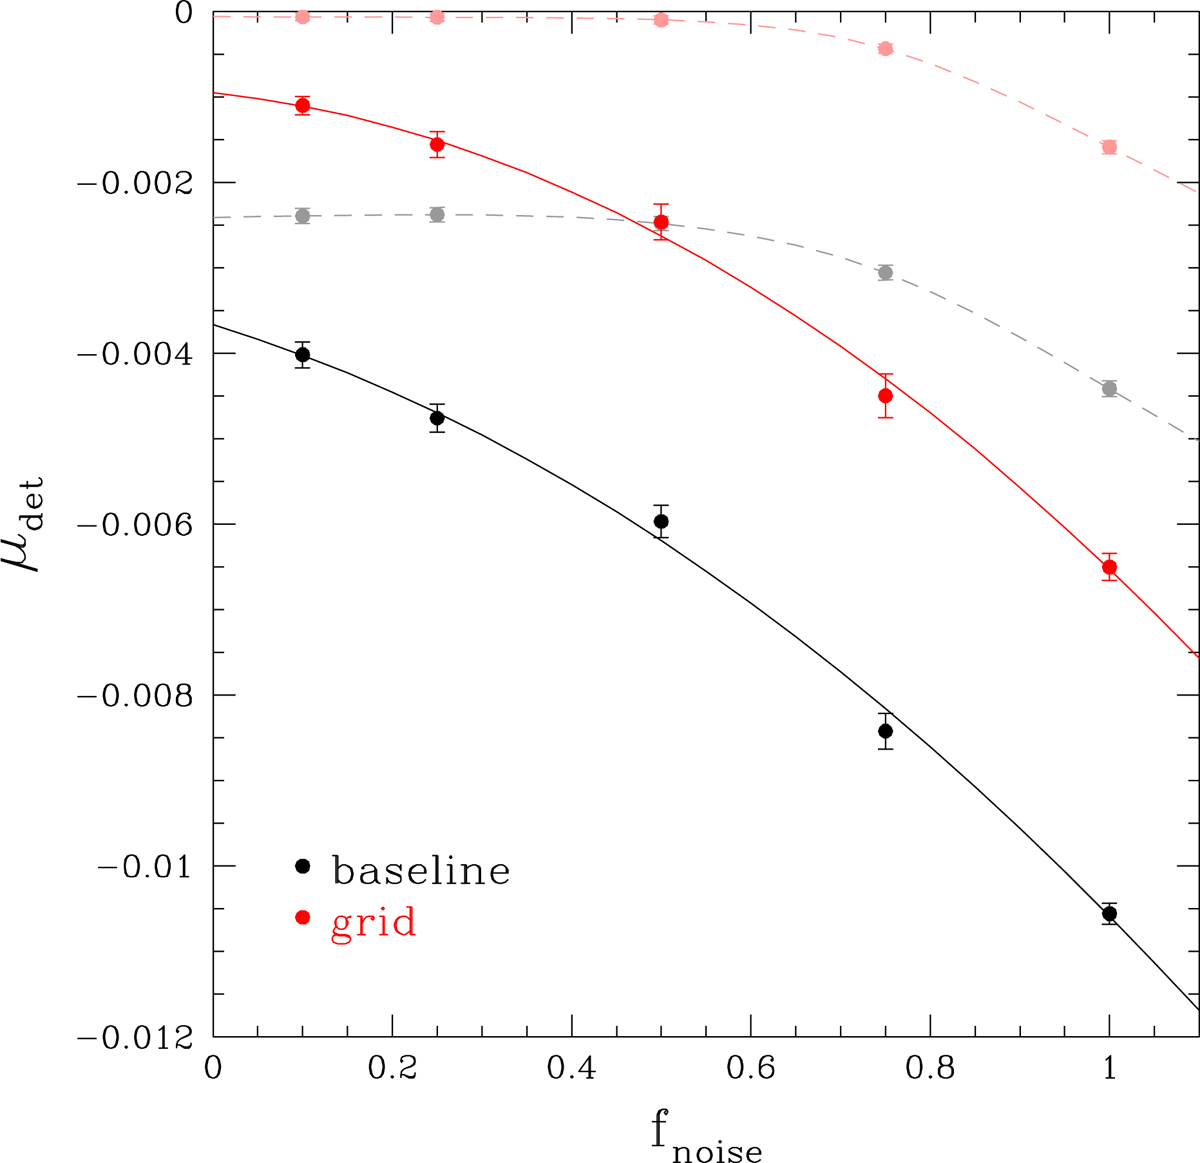
Multiplicative detection bias μdet as a function of the background noise level, which is multiplied by a factor fnoise with respect to the baseline case. The black and red lines correspond to the baseline and grid-based cases, respectively. The solid lines show results for galaxies with 20 < mAUTO < 24.5, whereas the (light-coloured) dashed lines indicate the bias if we select using the input magnitudes, 20 < minput < 24.5. In the latter case the bias vanishes for the grid-based case as the noise level is low, but for the baseline case the bias plateaus to μdet = −0.0024 as a result of blending.
Current usage metrics show cumulative count of Article Views (full-text article views including HTML views, PDF and ePub downloads, according to the available data) and Abstracts Views on Vision4Press platform.
Data correspond to usage on the plateform after 2015. The current usage metrics is available 48-96 hours after online publication and is updated daily on week days.
Initial download of the metrics may take a while.