Fig. 4.
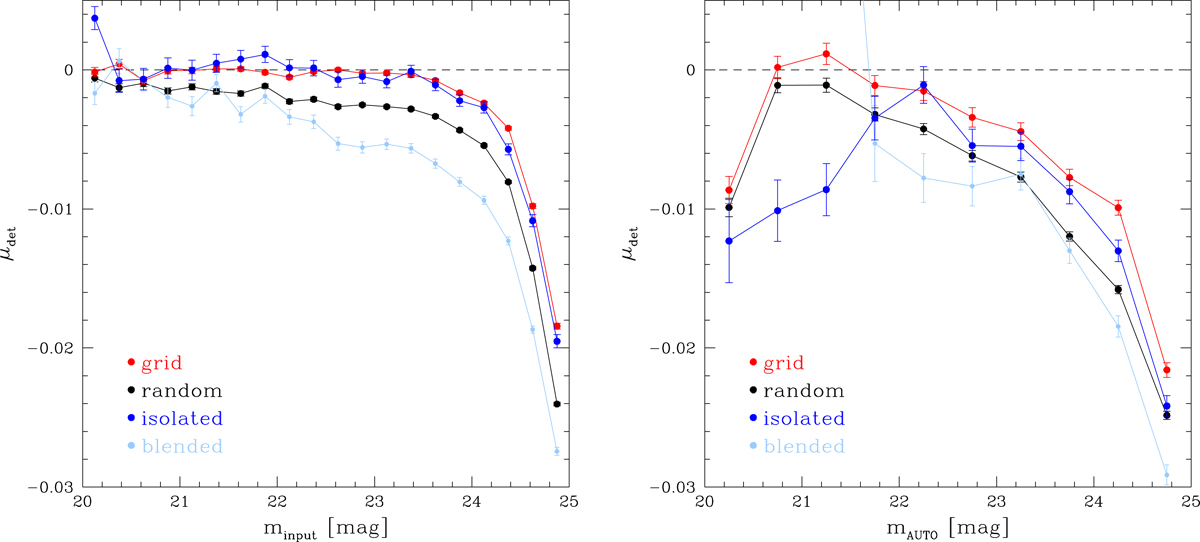
Left panel: multiplicative detection bias μdet as a function of the input apparent magnitude when galaxies are placed on a grid (red points) or placed randomly (black points). The blue points show the results for isolated galaxies where the nearest neighbour is more than 5″ away, whereas the light blue points show the detection bias for galaxies with a neighbour within 2″ (blended). Right panel: multiplicative detection bias as a function of observed properties. The classification into isolated and blended galaxies is based on the nearest detected galaxy in this case. The lines connect the points to show the behaviour for the different samples more clearly. The bias for the bright blended galaxies is beyond the axis limits of the chart.
Current usage metrics show cumulative count of Article Views (full-text article views including HTML views, PDF and ePub downloads, according to the available data) and Abstracts Views on Vision4Press platform.
Data correspond to usage on the plateform after 2015. The current usage metrics is available 48-96 hours after online publication and is updated daily on week days.
Initial download of the metrics may take a while.