Fig. 2.
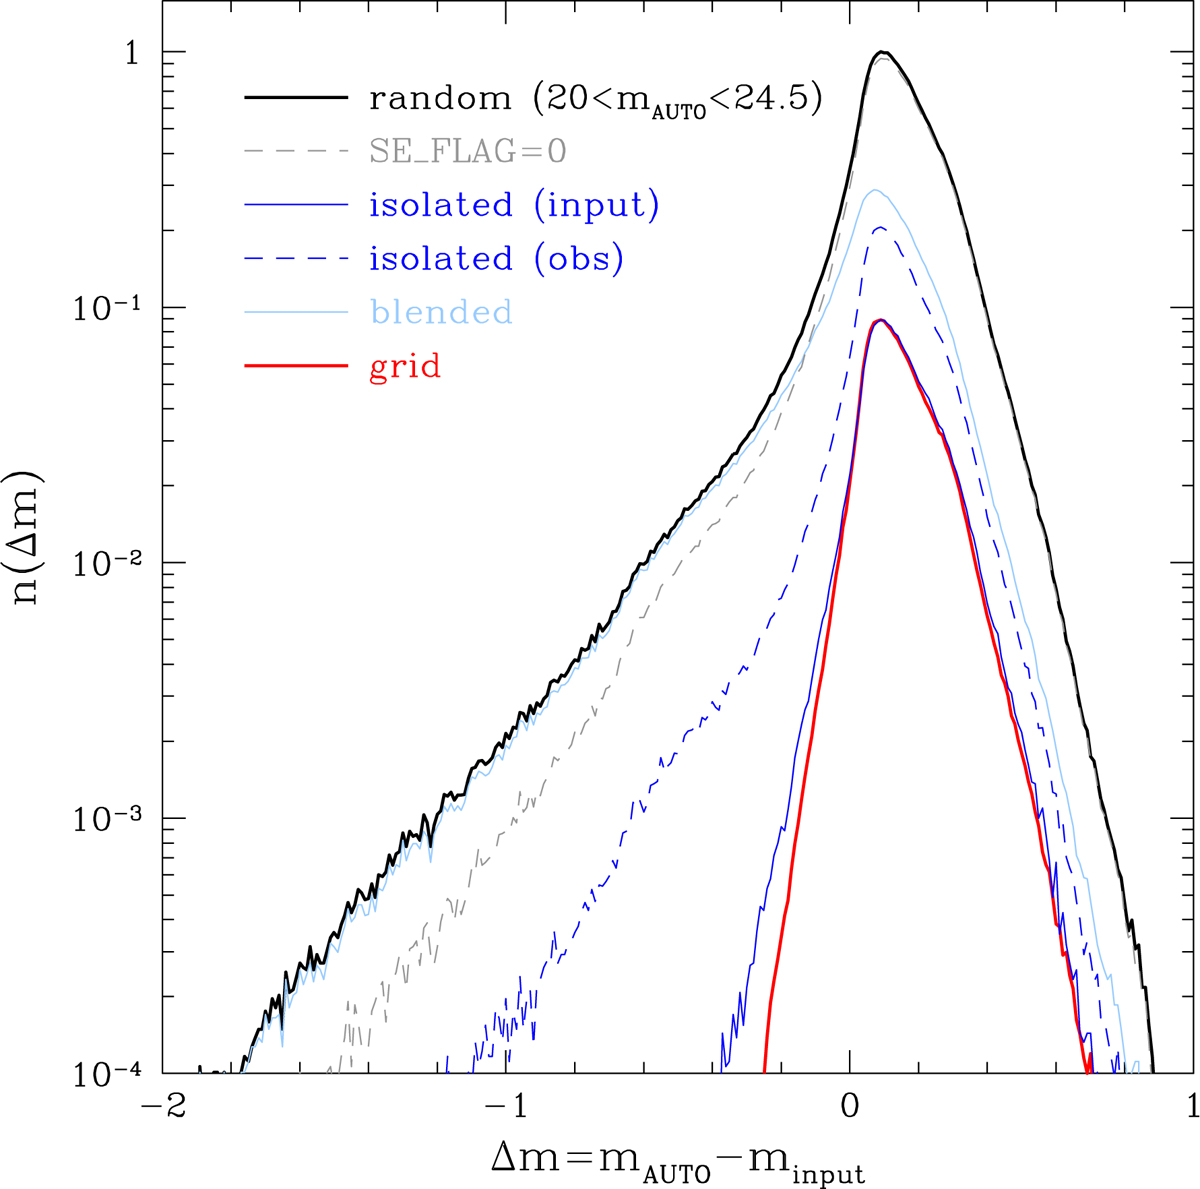
Distribution of Δm, the difference between mAUTO, the magnitude reported by SEXTRACTOR, and the input magnitude minput for detected galaxies with 20 < mAUTO < 24.5 for our baseline setup (solid black line; galaxies placed randomly). The distribution of ‘isolated’ galaxies (solid blue line) matches that of the grid-based results (red line), whereas the tail towards negative Δm matches that of ‘blended’ galaxies. The light grey dashed line shows that many of the objects flagged by SEXTRACTOR are indeed blends, but that many remain undetected. Blends even occur for objects that have no detected neighbour within 5″ (dashed blue line).
Current usage metrics show cumulative count of Article Views (full-text article views including HTML views, PDF and ePub downloads, according to the available data) and Abstracts Views on Vision4Press platform.
Data correspond to usage on the plateform after 2015. The current usage metrics is available 48-96 hours after online publication and is updated daily on week days.
Initial download of the metrics may take a while.