Fig. B.1.
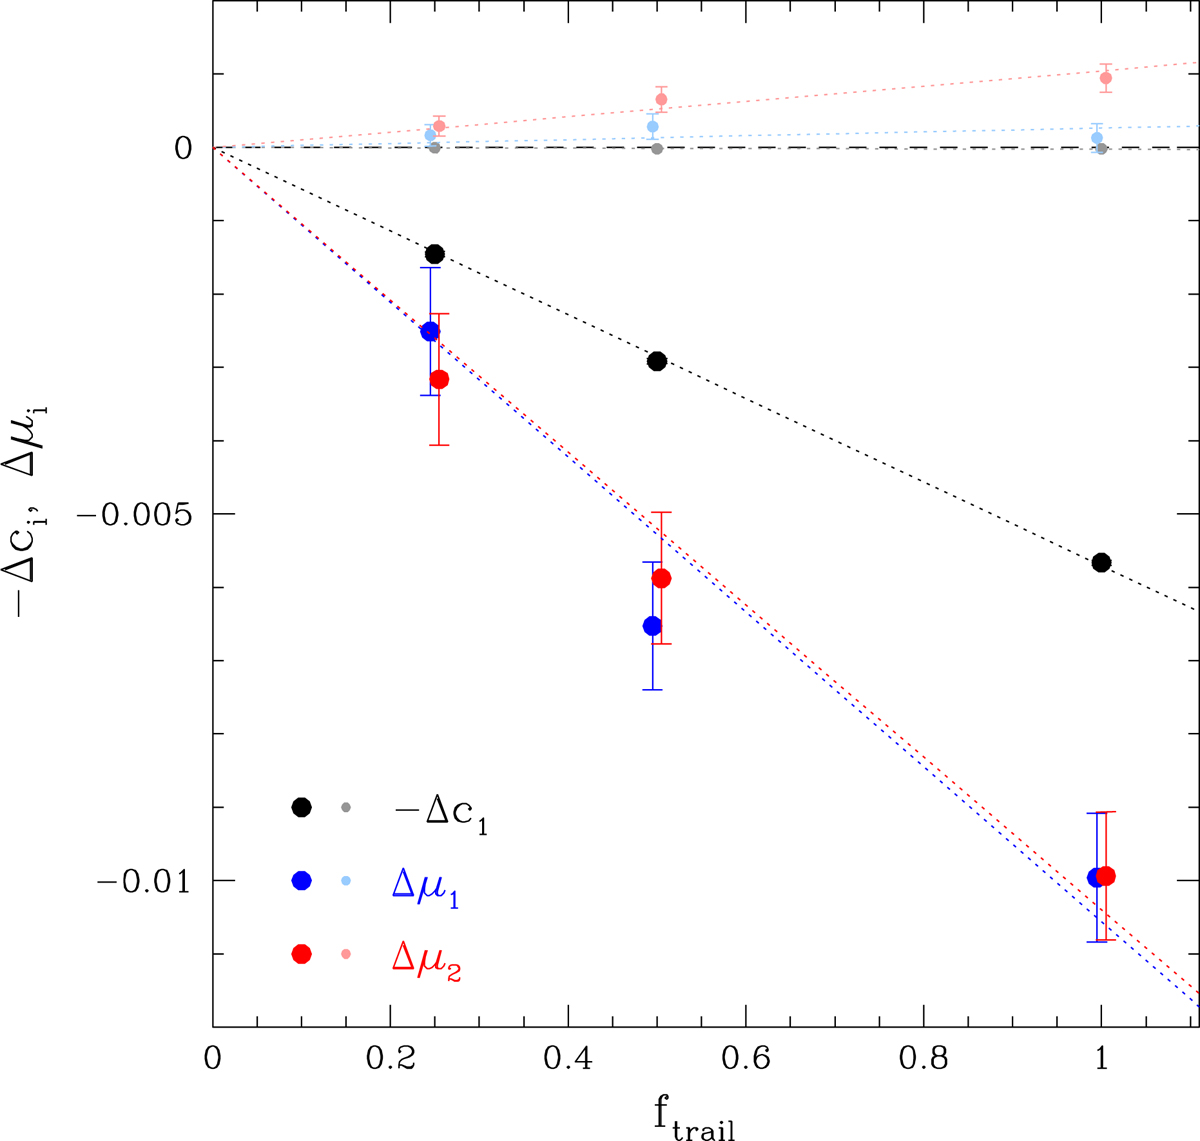
Comparison of the change in multiplicative bias and additive bias when some of the charge is trailed during the readout process. The amount of trailing is determined by the value of ftrail. The light coloured points show the (small) detection biases, whereas the bright coloured points show the −Δc1 (black), Δμ1 (blue) and Δμ2 (red). The amplitude of the additive bias is about half of the multiplicative bias, but has the opposite sign, as predicted.
Current usage metrics show cumulative count of Article Views (full-text article views including HTML views, PDF and ePub downloads, according to the available data) and Abstracts Views on Vision4Press platform.
Data correspond to usage on the plateform after 2015. The current usage metrics is available 48-96 hours after online publication and is updated daily on week days.
Initial download of the metrics may take a while.