Fig. 17.
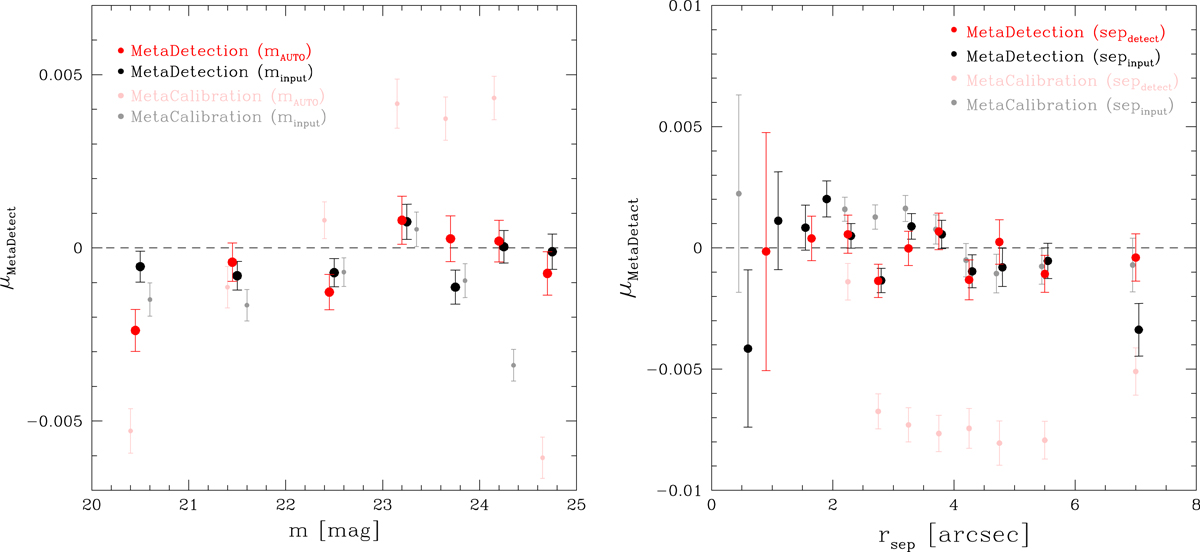
Left panel: multiplicative bias after METADETECTION as a function of magnitude, with galaxies selected by the input magnitude (black) or the observed magnitude (red). Right panel: multiplicative bias for galaxies with 20 < mAUTO < 24.5 as a function or rsep, the distance to the nearest neighbour in the input catalogue (black points) and the distance to the nearest detected galaxy (red points). The light coloured points indicate the corresponding results for METACALIBRATION. In the case of METADETECTION the biases show no trend with magnitude or distance to the nearest galaxy, and are consistent with zero.
Current usage metrics show cumulative count of Article Views (full-text article views including HTML views, PDF and ePub downloads, according to the available data) and Abstracts Views on Vision4Press platform.
Data correspond to usage on the plateform after 2015. The current usage metrics is available 48-96 hours after online publication and is updated daily on week days.
Initial download of the metrics may take a while.