Fig. 16.
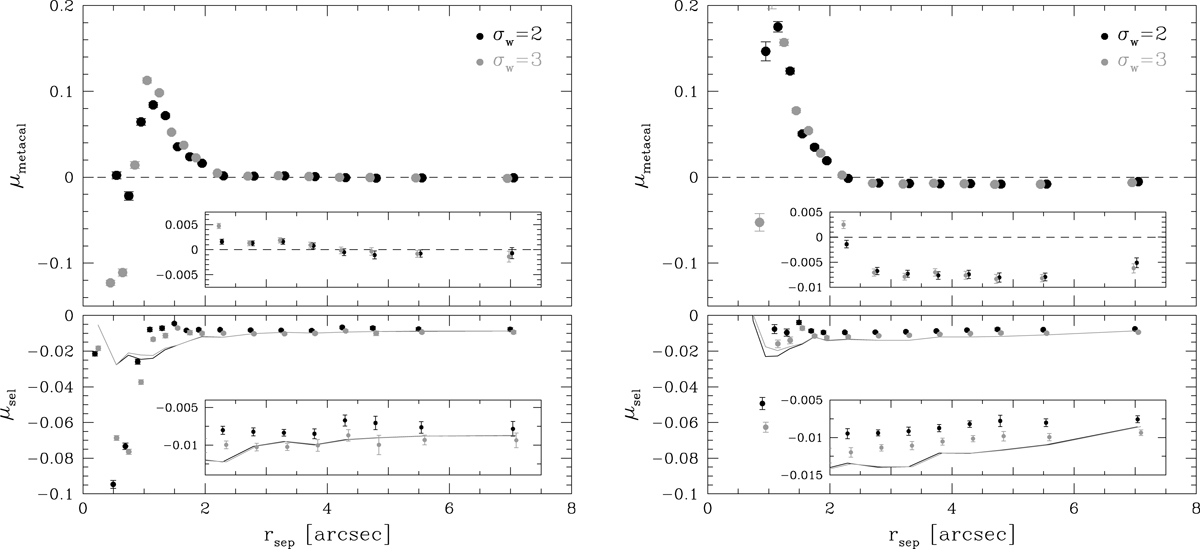
Left panel: multiplicative bias after full METACALIBRATION for galaxies with 20 < mAUTO < 24.5 as a function of the separation to the nearest galaxy with minput < 26 in the input catalogue (top) and selection bias (bottom) for a weight function with σw = 2 pixels (black) and σw = 3 pixels (grey). Right panel: idem, but now as a function of distance to the nearest detected galaxy. The insets in the panels zoom in on the results for separations larger than 2″. The solid lines in the bottom panels show the corresponding direct measurements of the selection bias.
Current usage metrics show cumulative count of Article Views (full-text article views including HTML views, PDF and ePub downloads, according to the available data) and Abstracts Views on Vision4Press platform.
Data correspond to usage on the plateform after 2015. The current usage metrics is available 48-96 hours after online publication and is updated daily on week days.
Initial download of the metrics may take a while.