Fig. 14.
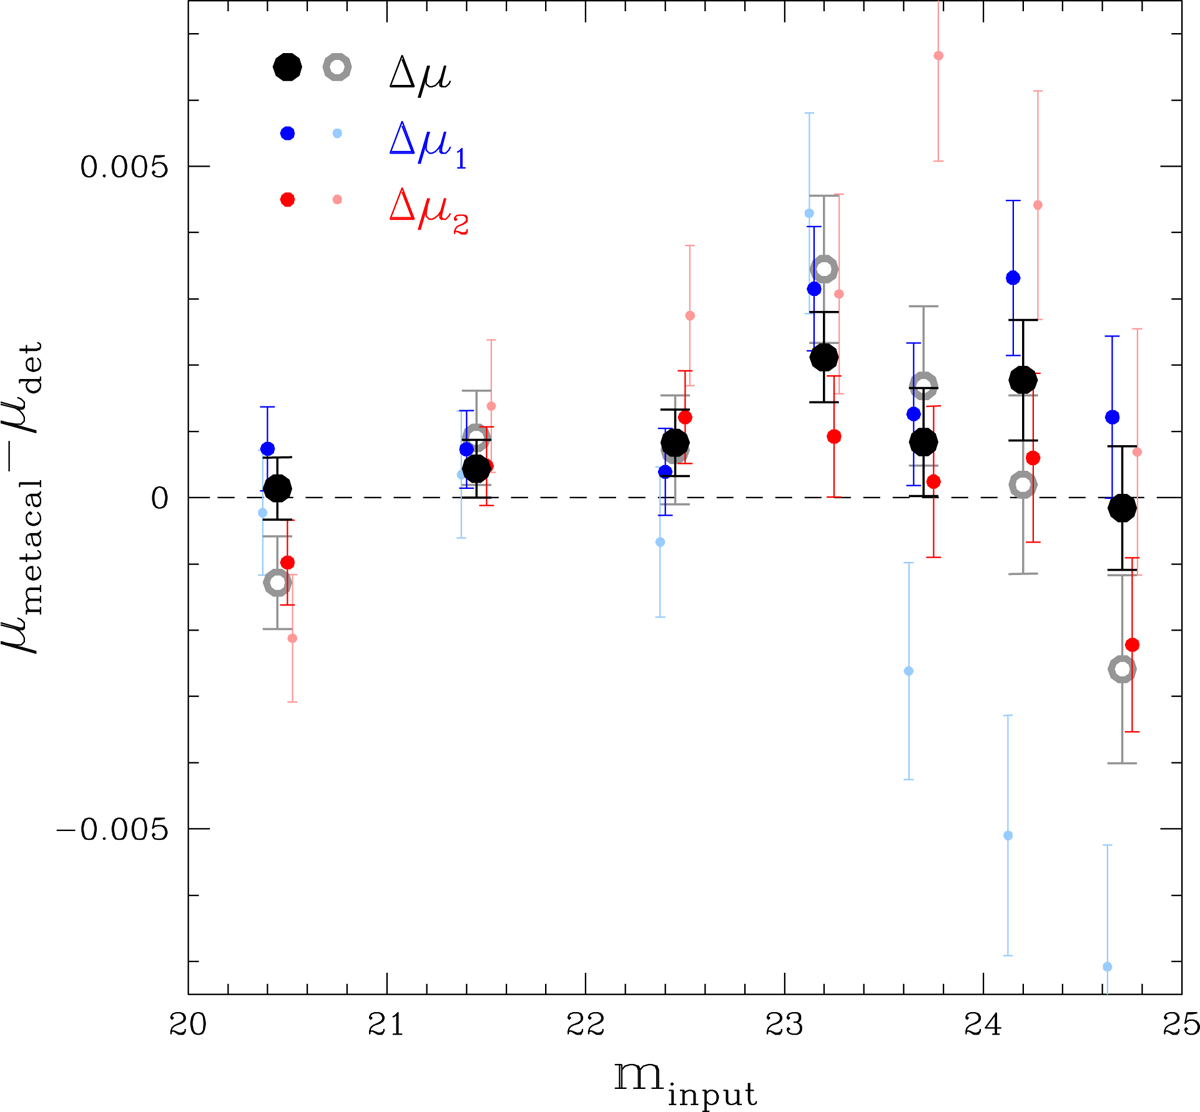
Difference between the multiplicative bias after METACALIBRATION, μmetacal and detection bias, μdet, as a function of the input magnitude minput for the grid-based simulations. The bright (light) colours show the results when we apply a shear of ±0.02 (±0.01) in the metacalibration step. The solid black (open grey) points show the average bias, and the blue (red) points indicate Δμ1 (Δμ2). Using a larger shear results in smaller uncertainties and a better agreement between the two shear components.
Current usage metrics show cumulative count of Article Views (full-text article views including HTML views, PDF and ePub downloads, according to the available data) and Abstracts Views on Vision4Press platform.
Data correspond to usage on the plateform after 2015. The current usage metrics is available 48-96 hours after online publication and is updated daily on week days.
Initial download of the metrics may take a while.