Free Access
Fig. 12.
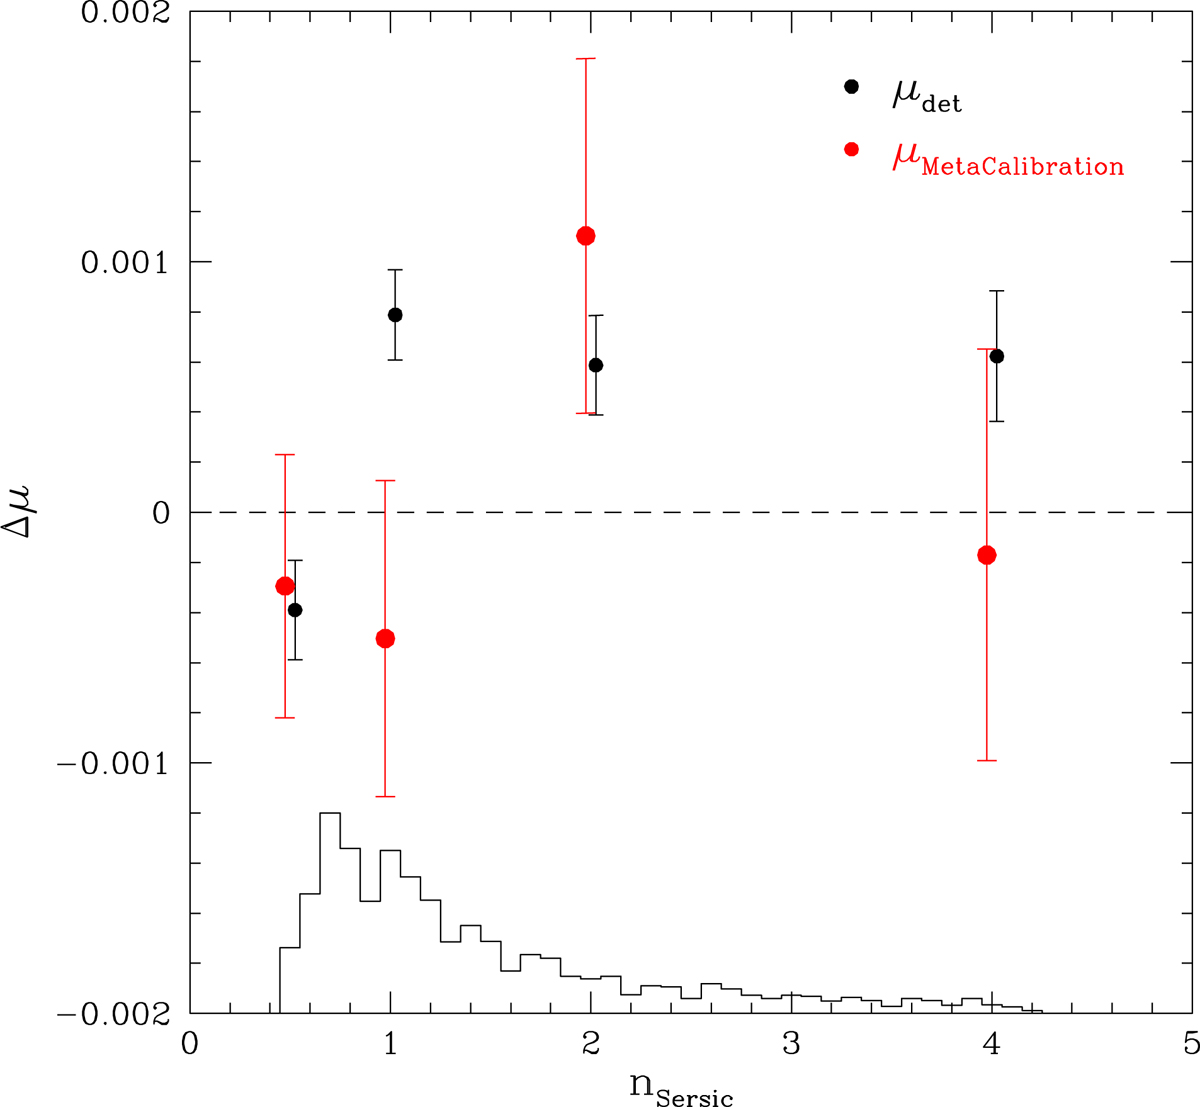
Change in multiplicative shear bias Δμ as a function Sérsic index. The histogram indicates the distribution of Sérsic indices in the baseline simulations. The black points show the change in detection bias. The red points show the METACALIBRATION results.
Current usage metrics show cumulative count of Article Views (full-text article views including HTML views, PDF and ePub downloads, according to the available data) and Abstracts Views on Vision4Press platform.
Data correspond to usage on the plateform after 2015. The current usage metrics is available 48-96 hours after online publication and is updated daily on week days.
Initial download of the metrics may take a while.