Fig. 11.
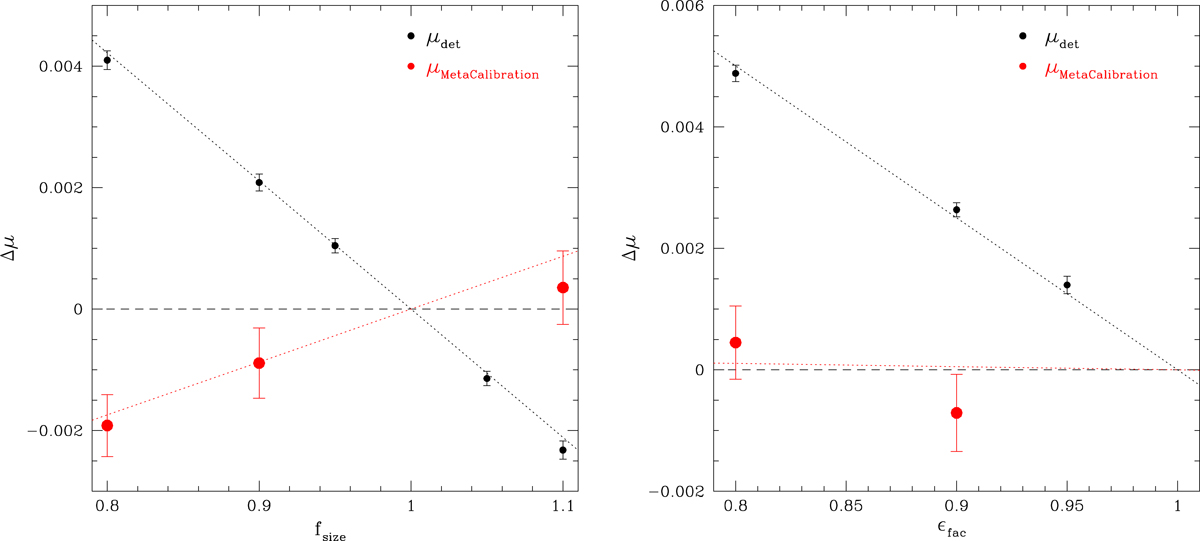
Left panel: change in multiplicative shear detection bias Δμ as a function of fsize, the relative change in input galaxy size (black points). Right panel: change in multiplicative detection bias if the input ellipticities are multiplied by a factor ϵfac. The dotted lines show the best fit linear model. The red points in both panels correspond to the post-METACALIBRATION results discussed in Sect. 5.
Current usage metrics show cumulative count of Article Views (full-text article views including HTML views, PDF and ePub downloads, according to the available data) and Abstracts Views on Vision4Press platform.
Data correspond to usage on the plateform after 2015. The current usage metrics is available 48-96 hours after online publication and is updated daily on week days.
Initial download of the metrics may take a while.