Fig. 10.
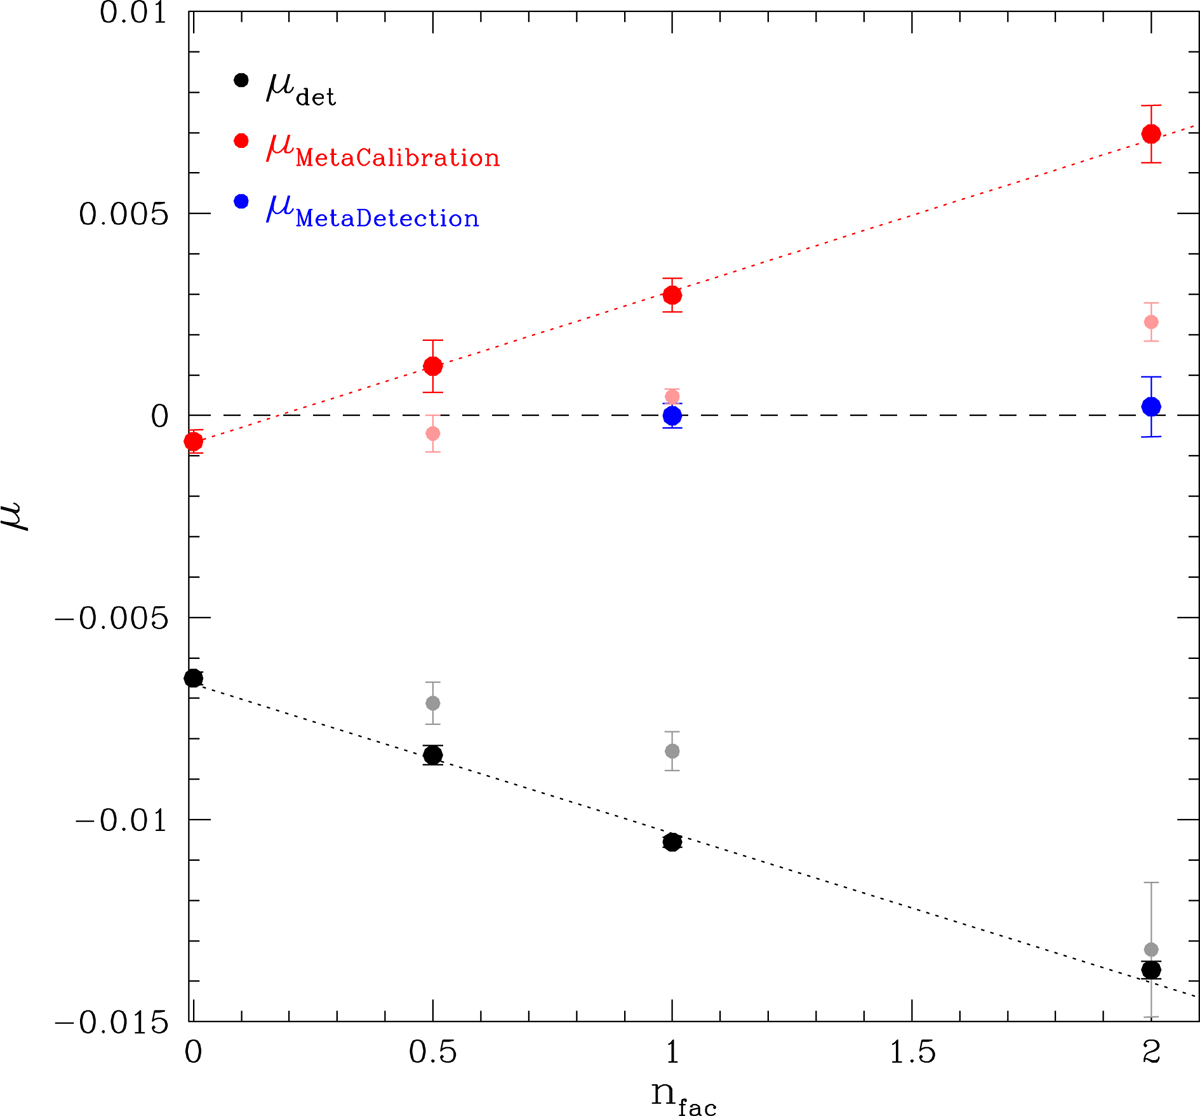
Multiplicative bias as a function of nfac, the relative increase in galaxy number density with respect to the baseline simulation. The grid-based results correspond to nfac = 0. The black points show how the detection bias increases with nfac. The red (blue) points correspond to the METACALIBRATION (METADETECTION) results discussed in Sect. 5 (Sect. 6). The light coloured points show the biases for relatively isolated galaxies (distance to nearest galaxy in the input catalogue larger than 2″).
Current usage metrics show cumulative count of Article Views (full-text article views including HTML views, PDF and ePub downloads, according to the available data) and Abstracts Views on Vision4Press platform.
Data correspond to usage on the plateform after 2015. The current usage metrics is available 48-96 hours after online publication and is updated daily on week days.
Initial download of the metrics may take a while.