Fig. 1.
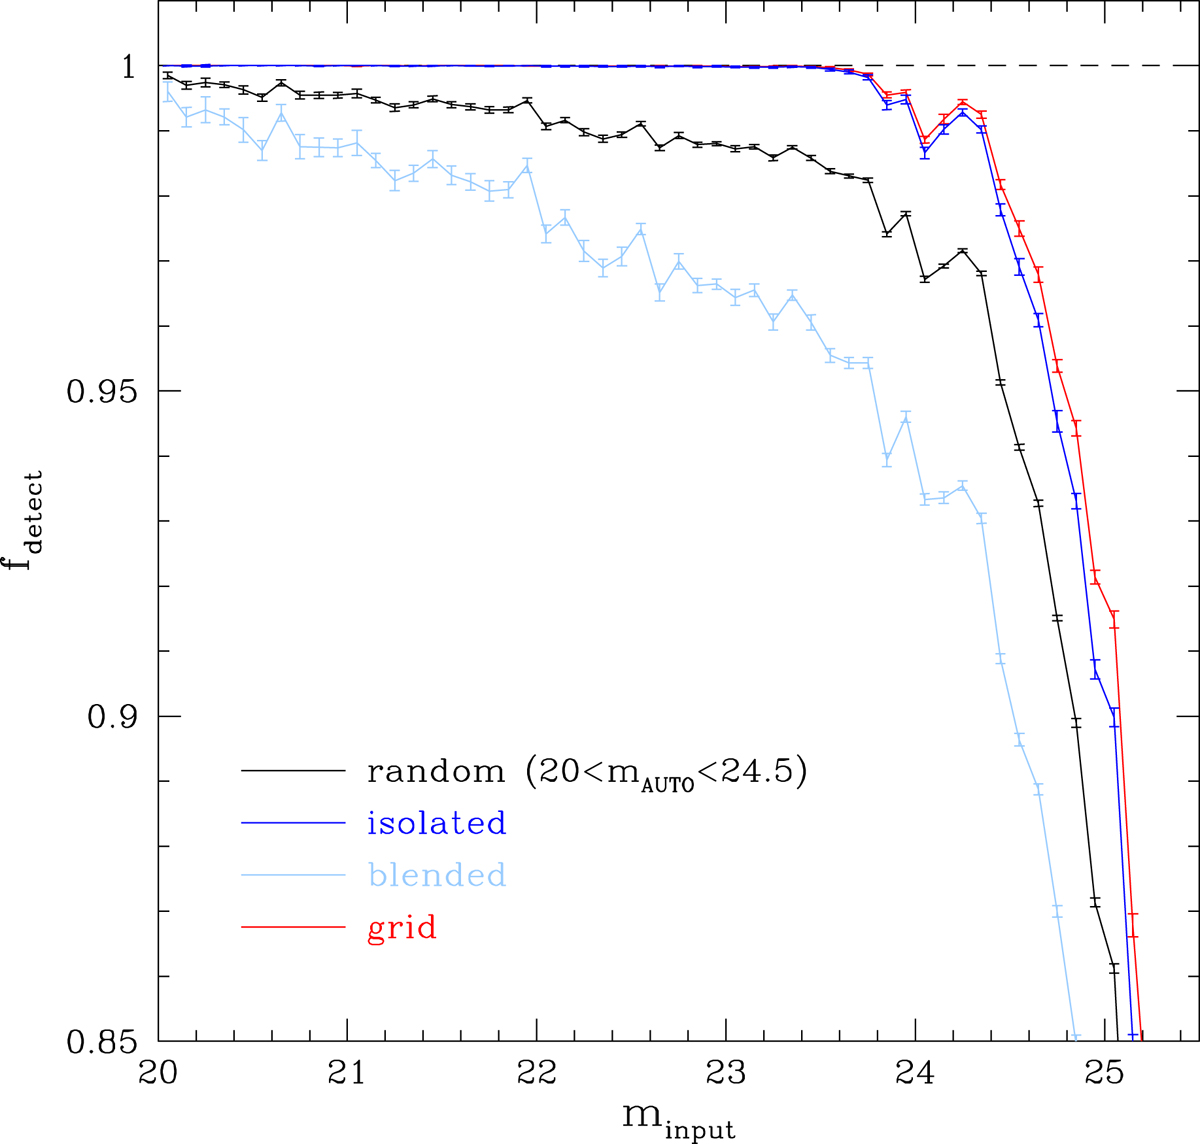
Fraction of the simulated galaxies that are detected by SEXTRACTOR as a function of the input magnitude, minput. The black line corresponds to the reference case where galaxies are placed randomly in the images. The blue line shows results for ‘isolated’ galaxies, with a nearest neighbour more than 5″ away, whereas the light blue line is for galaxies with a nearest neighbour within 2″. In the latter case the fraction of detected galaxies is considerably lower, whereas the results for the ‘isolated’ galaxies approaches that of the simulations where galaxies are placed on a grid about 9″ apart (red lines). The error bars indicate the scatter in the results, and the lines connect the points.
Current usage metrics show cumulative count of Article Views (full-text article views including HTML views, PDF and ePub downloads, according to the available data) and Abstracts Views on Vision4Press platform.
Data correspond to usage on the plateform after 2015. The current usage metrics is available 48-96 hours after online publication and is updated daily on week days.
Initial download of the metrics may take a while.