Fig. 4.
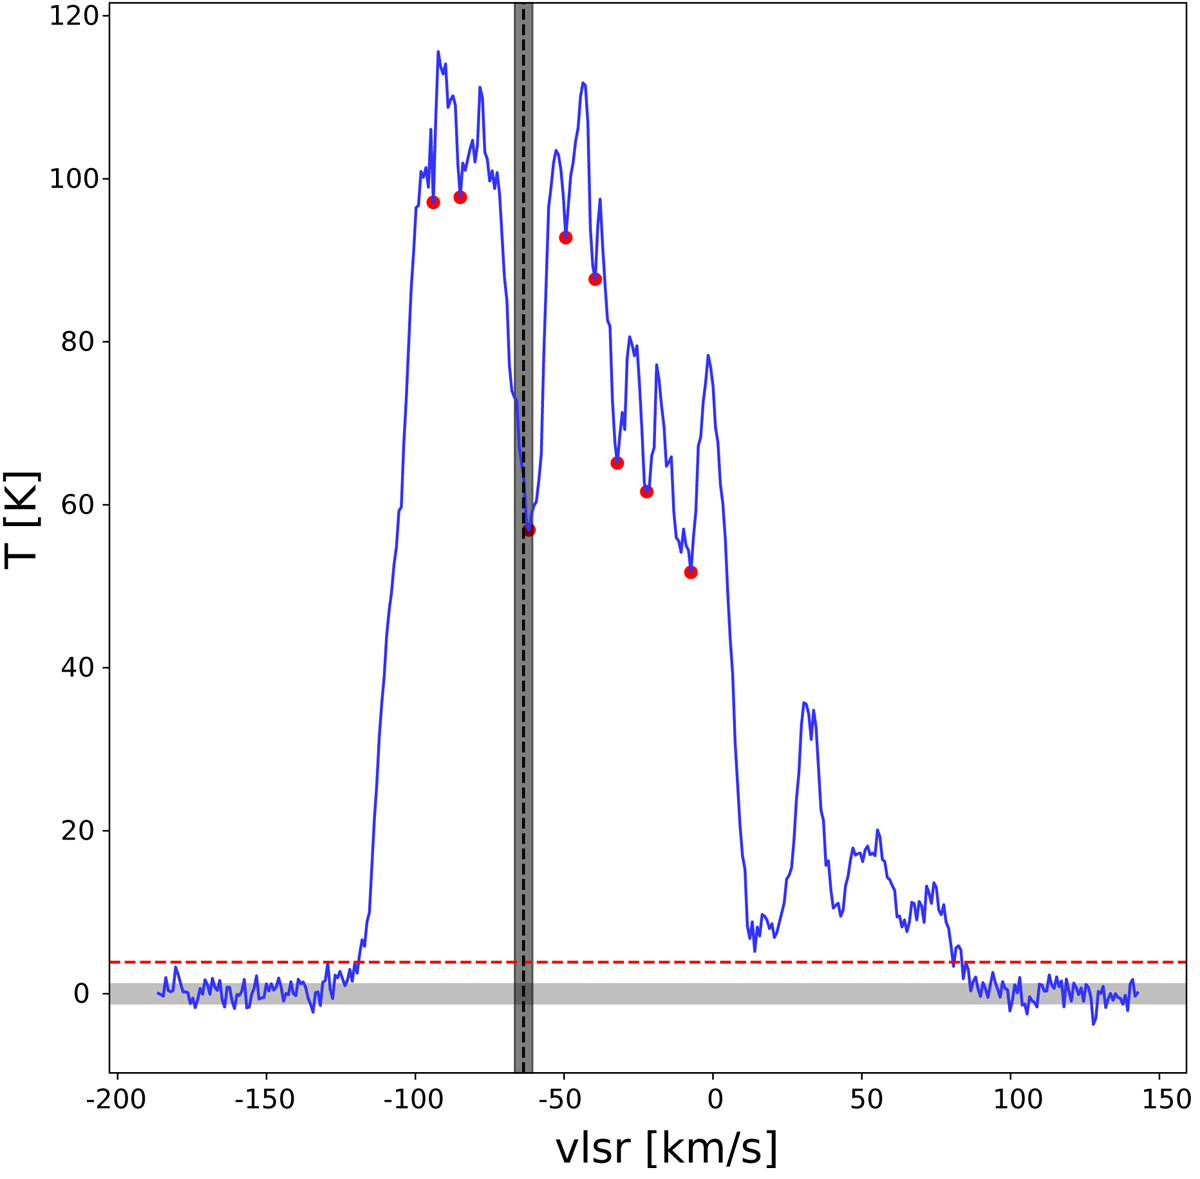
Example of HISA identification for the source HIGALBM329.2039+0.7101 with assigned VLSR = −63.562 km s−1. The H I profile is plotted in blue, and the identified dips are shown as red dots. The horizontal gray thick line shows the ±σnoise and the dashed red line shows the 3σnoise level. The black vertical dashed line and the gray shadow are the velocity of the source and the 3 km s−1 tolerance.
Current usage metrics show cumulative count of Article Views (full-text article views including HTML views, PDF and ePub downloads, according to the available data) and Abstracts Views on Vision4Press platform.
Data correspond to usage on the plateform after 2015. The current usage metrics is available 48-96 hours after online publication and is updated daily on week days.
Initial download of the metrics may take a while.