Fig. 3.
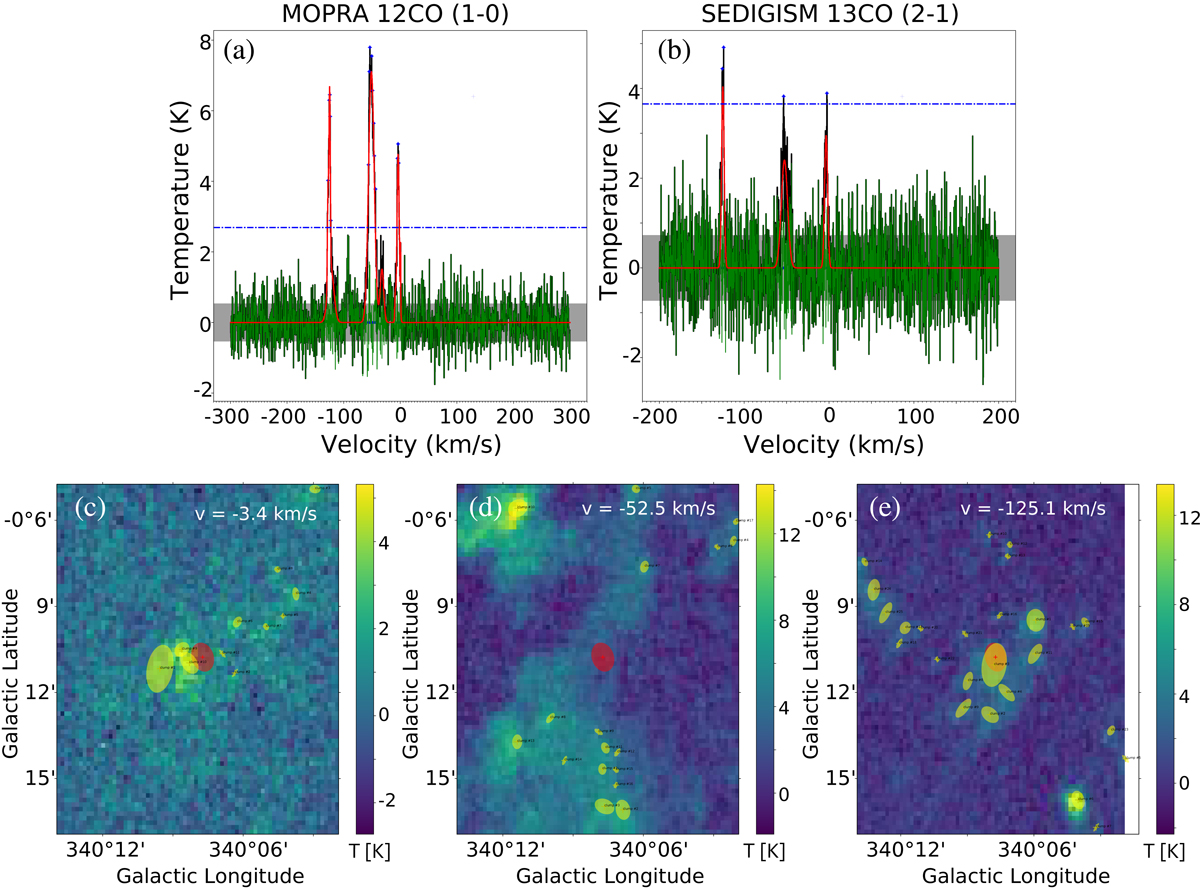
Example of the morphological analysis of the molecular emission for the Hi-GAL source HIGALBM340.1288-0.1837. The upper panels show the MOPRA 12CO(1–0) (a) and SEDIGISM 13CO(2–1) (b) fitted spectra. The labels in these panels are the same as in Fig. 2. The lower panels show the channel maps at −3.4 km s−1 (c), −52.5 km s−1 (d), and −125.1 km s−1 (e). The red ellipse is the footprint of the Hi-GAL source while the yellow ellipses are the footprints of the structures extracted by SExtractor.
Current usage metrics show cumulative count of Article Views (full-text article views including HTML views, PDF and ePub downloads, according to the available data) and Abstracts Views on Vision4Press platform.
Data correspond to usage on the plateform after 2015. The current usage metrics is available 48-96 hours after online publication and is updated daily on week days.
Initial download of the metrics may take a while.