Fig. 2.
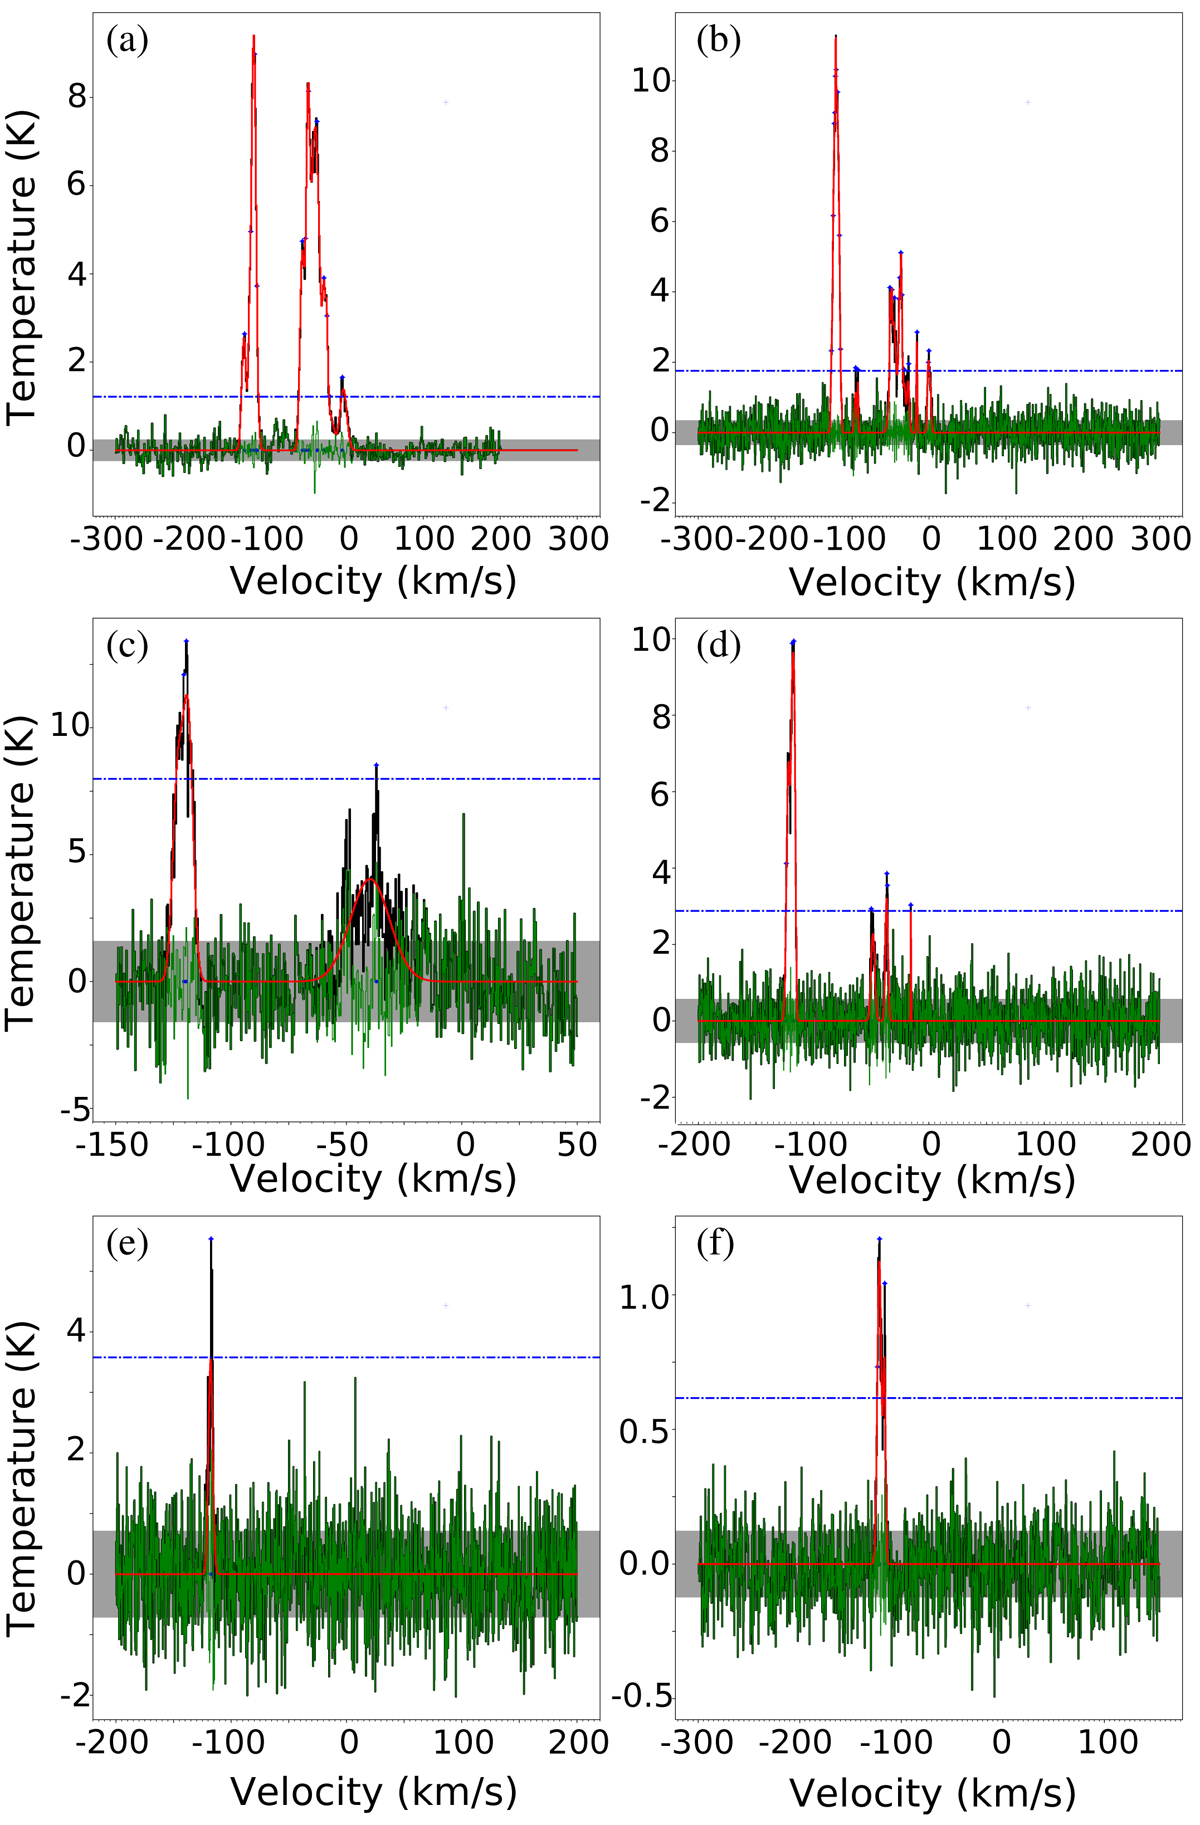
Example of fitted molecular spectra for VLSR detection for the Hi-GAL source HIGALBM340.2690-0.0542. The spectra are (a) NANTEN 12CO(1–0), (b) MOPRA 12CO(1–0), (c) TRUMMS 12CO(1–0), (d) SEDIGISM 13CO(2–1), (e) SEDIGISM C18O(2–1), (f) MALT90 HCO+. In all panels the black, red, and green curves are the extracted profile, the fitted lines, and the residual, respectively. The background gray area is the ±σnoise value where σnoise is the root mean squared value of the noise amplitude (see Appendix A). The horizontal blue line shows the 5σ level.
Current usage metrics show cumulative count of Article Views (full-text article views including HTML views, PDF and ePub downloads, according to the available data) and Abstracts Views on Vision4Press platform.
Data correspond to usage on the plateform after 2015. The current usage metrics is available 48-96 hours after online publication and is updated daily on week days.
Initial download of the metrics may take a while.