Fig. 14.
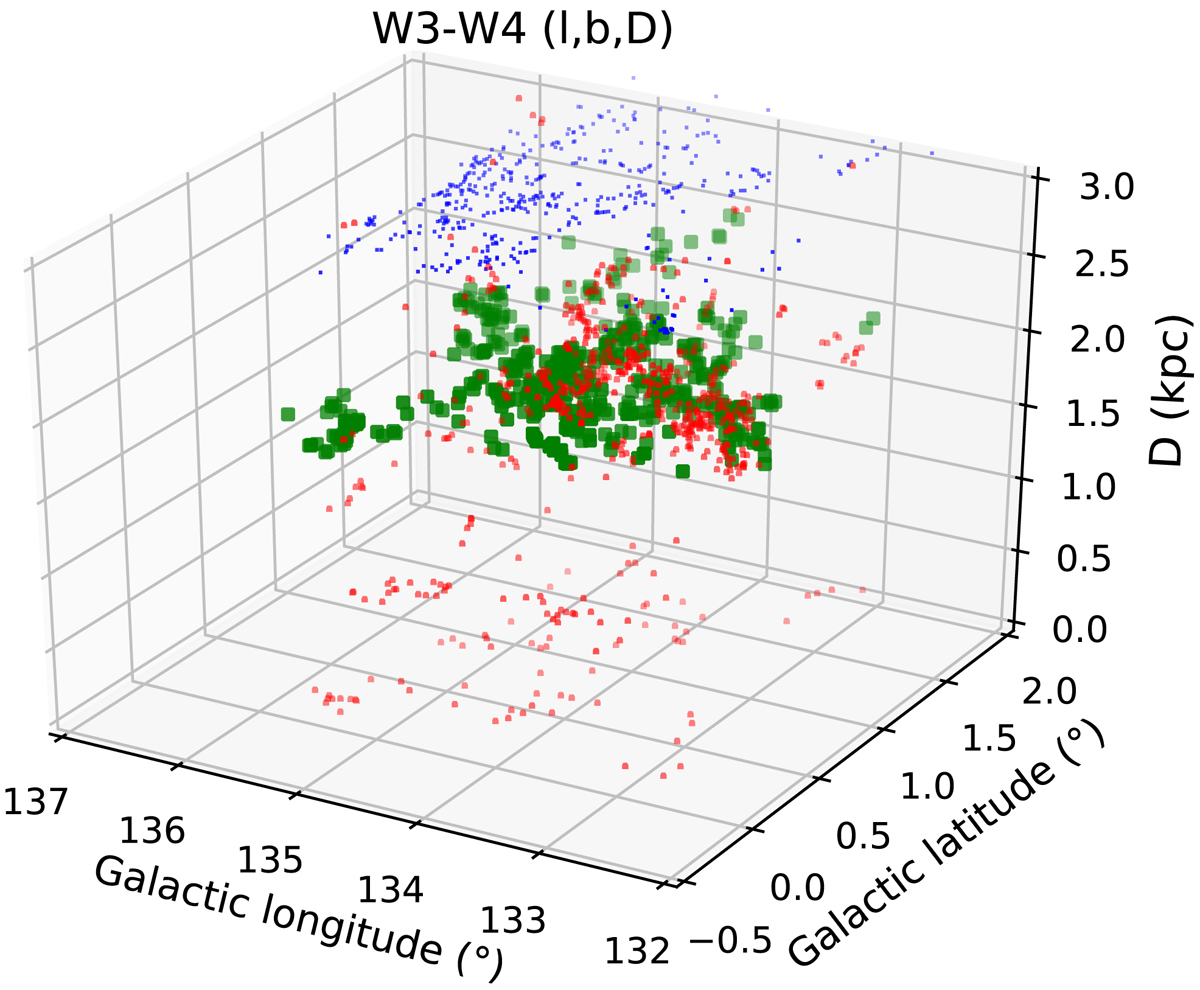
Three-dimensional (l, b, D) diagram for the W3–W4 regions. 478 (43%) sources are observed in the range 1.8–2.3 kpc, the range of distances obtained by Zucker et al. (2020) for these two star forming regions. The color coding is the same as in Fig. 13, that is, sources in the range 1.8–2.3 kpc are coded in green, sources outside this range are coded in red, and unfitted sources (with no distance information) are coded in blue; the distance layer for these latter sources is put arbitrarily at 3 kpc for clarity in the plot.
Current usage metrics show cumulative count of Article Views (full-text article views including HTML views, PDF and ePub downloads, according to the available data) and Abstracts Views on Vision4Press platform.
Data correspond to usage on the plateform after 2015. The current usage metrics is available 48-96 hours after online publication and is updated daily on week days.
Initial download of the metrics may take a while.