Fig. 12.
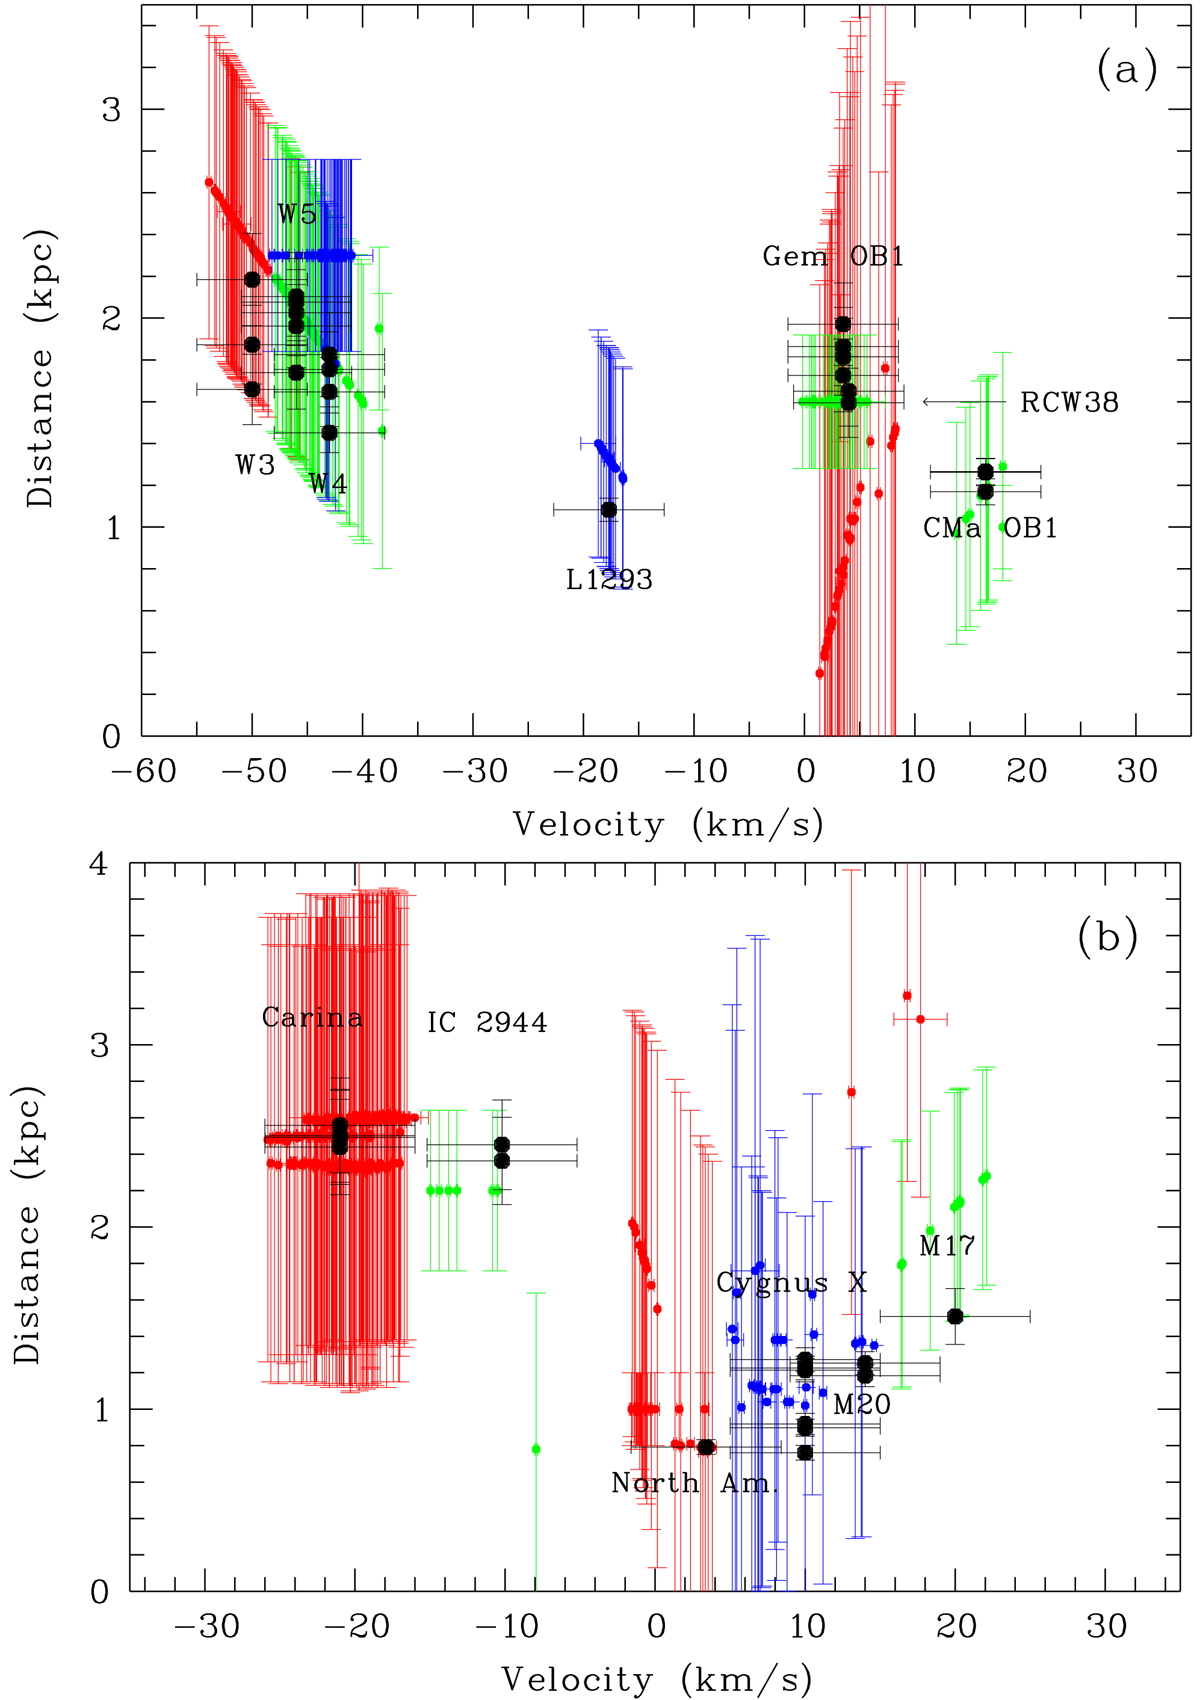
Velocity–distance plot of Hi-GAL sources in regions from Zucker et al. (2020) for sources in quadrants 1 and 2 (a) and in quadrants 2 and 4 (b), respectively. The velocity (±5 km s−1) and the distance (and its uncertainty) of the sight lines as listed in Zucker et al. (2020) are plotted in black. In panel a the Hi-GAL sources are plotted in red (for W3 and GemOB1), blue (for W5 and L1293), and green (for W5, CMaOB1 and RCW38). In panel b the Hi-GAL sources are plotted in red (for Carina, North America, and M20), blue (for Cygnus X), and green (for IC 2944 and M17).
Current usage metrics show cumulative count of Article Views (full-text article views including HTML views, PDF and ePub downloads, according to the available data) and Abstracts Views on Vision4Press platform.
Data correspond to usage on the plateform after 2015. The current usage metrics is available 48-96 hours after online publication and is updated daily on week days.
Initial download of the metrics may take a while.