Fig. 10.
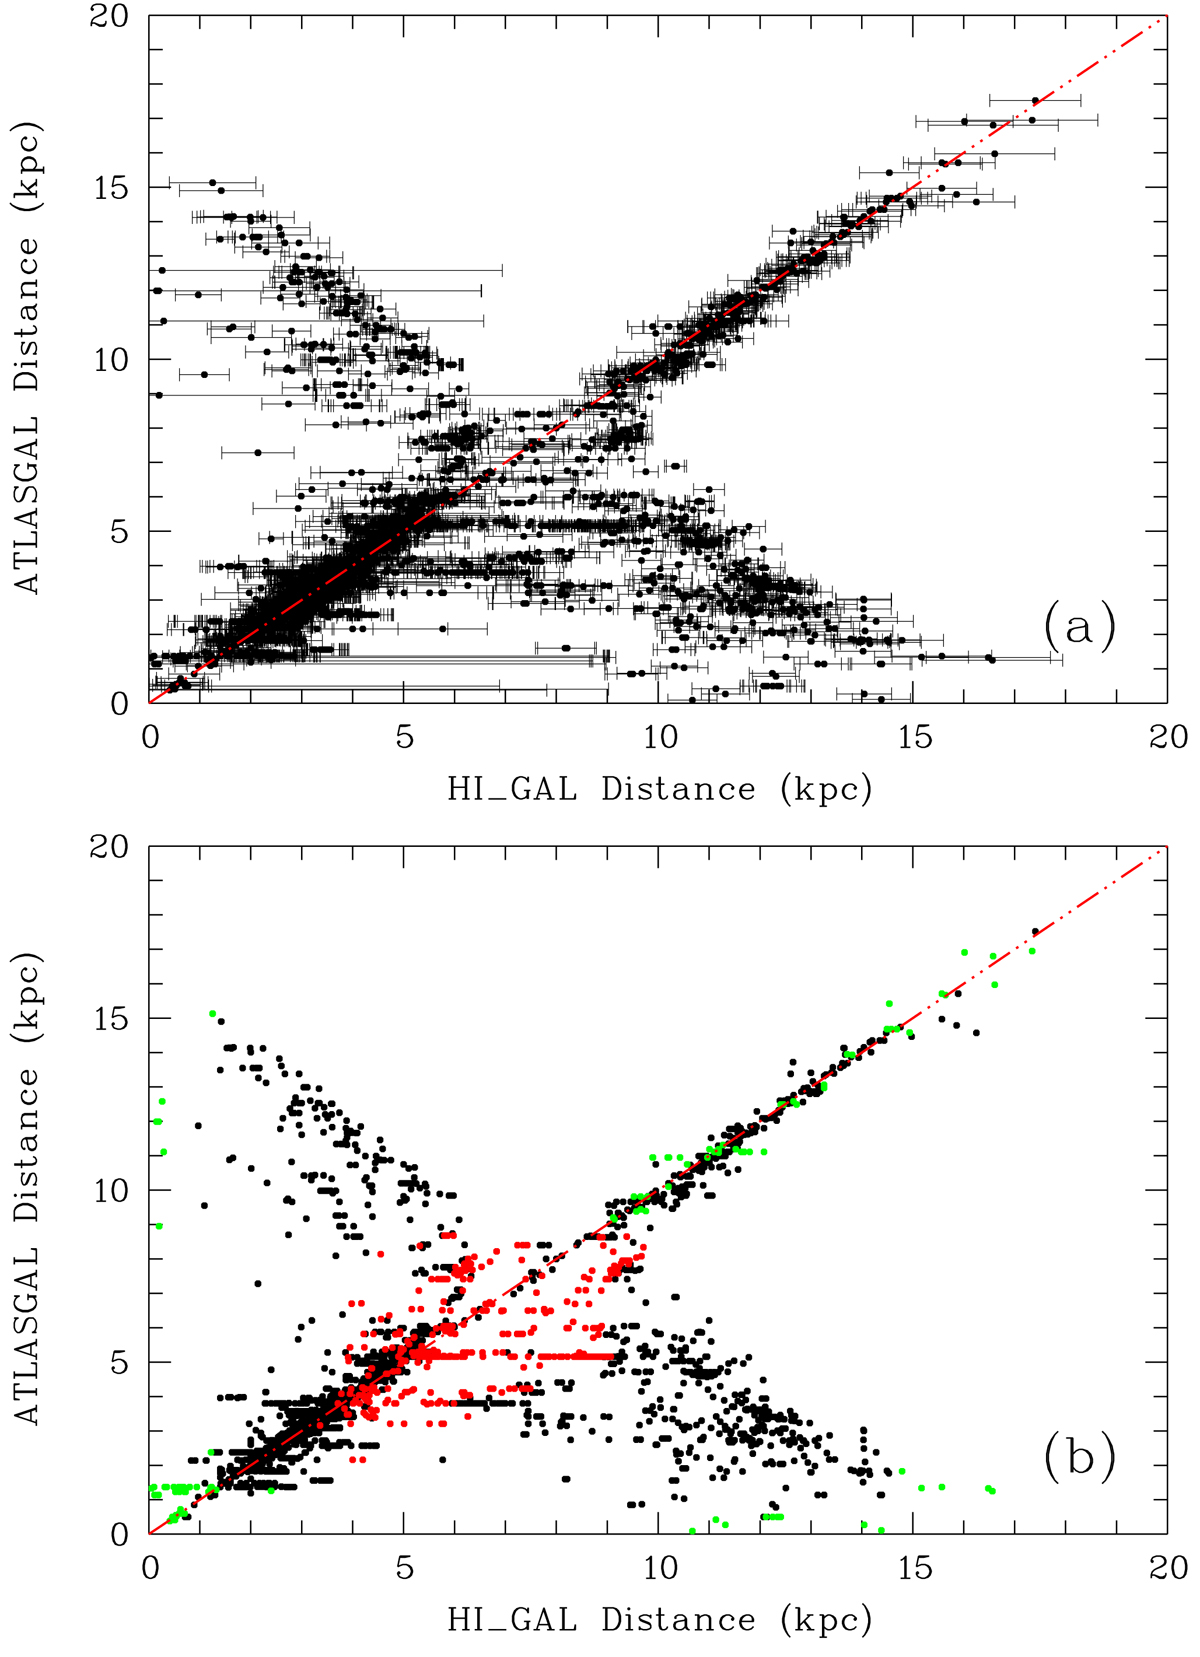
Distance comparison between paired ATLASGAL and Hi-GAL sources (3528 sources). (a) Sources with velocity difference less than 5 km s−1 and longitude outside ±12° around the center and anti center directions. (b) Same figure but identifying the sources placed at the tangent distance in ATLASGAL (in red), and the sources with velocity lower than 10 km s−1 (in green). The red dash-dotted line is the y = x line.
Current usage metrics show cumulative count of Article Views (full-text article views including HTML views, PDF and ePub downloads, according to the available data) and Abstracts Views on Vision4Press platform.
Data correspond to usage on the plateform after 2015. The current usage metrics is available 48-96 hours after online publication and is updated daily on week days.
Initial download of the metrics may take a while.