Fig. 8.
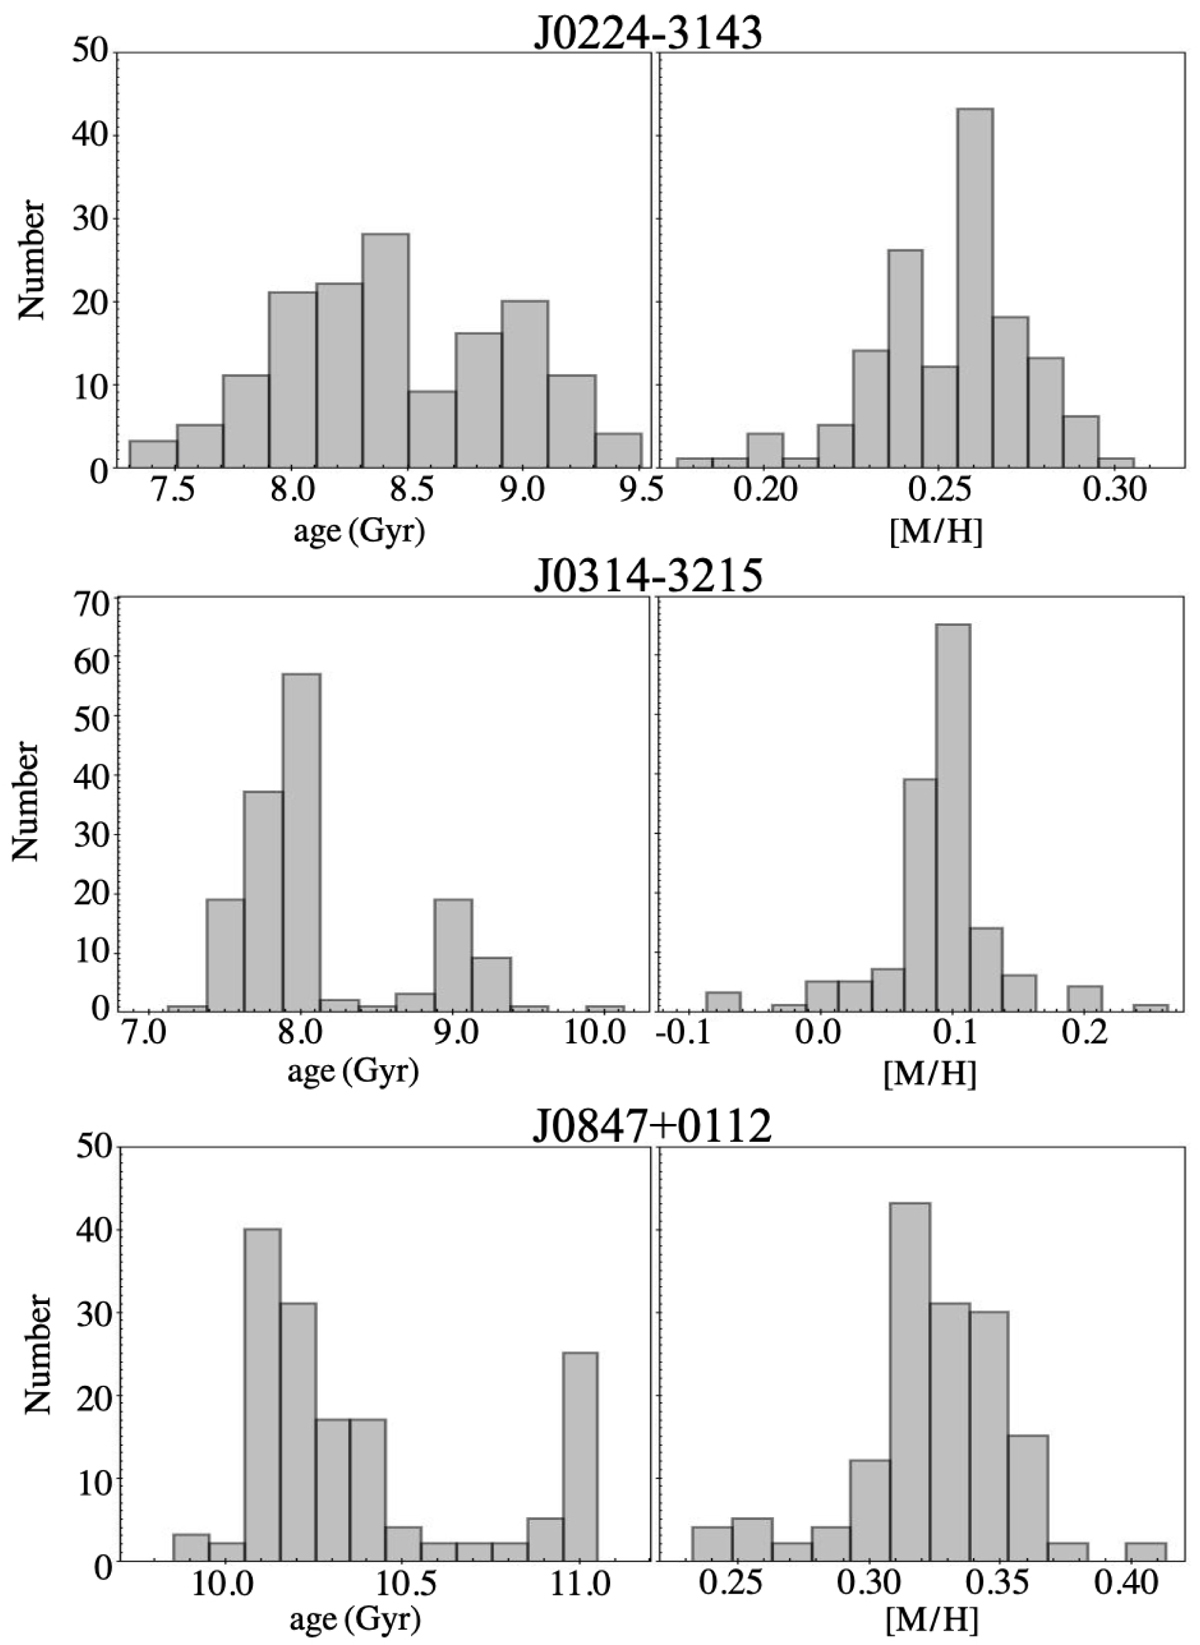
Histograms of the distribution of mass-weighted mean ages and metallicities inferred when repeating the fit 256 times; changing the parameters, the set-up, and the regularization, as described in the text. These distributions were only used to estimate the uncertainties on the values reported in Table 4. The mean ages ([M/H]) of the distributions shown here are not identical to the values found with the best possible setup (listed in the table) but do not differ by more than 1 Gyr (0.04 dex).
Current usage metrics show cumulative count of Article Views (full-text article views including HTML views, PDF and ePub downloads, according to the available data) and Abstracts Views on Vision4Press platform.
Data correspond to usage on the plateform after 2015. The current usage metrics is available 48-96 hours after online publication and is updated daily on week days.
Initial download of the metrics may take a while.