Fig. 5.
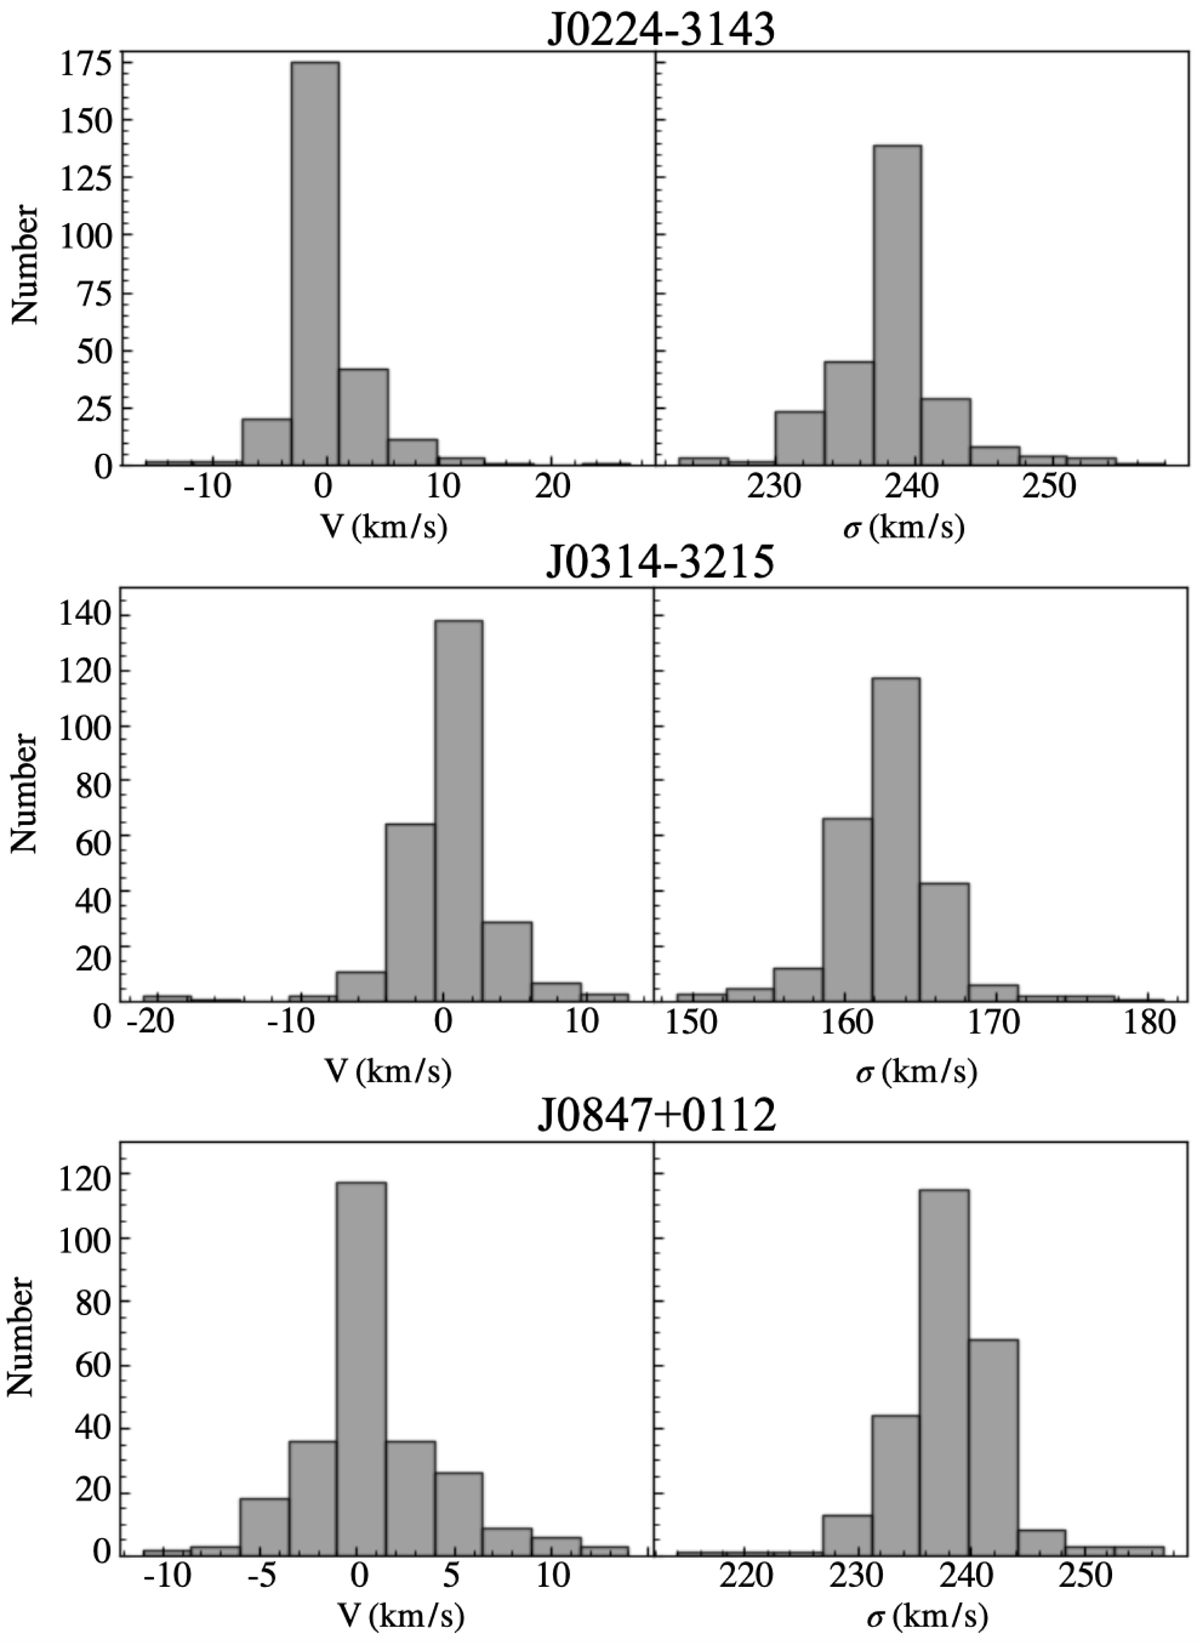
Distribution of velocities and velocity dispersions computed repeating the kinematical fit 256 times, changing the parameters and setup, as described in the text, to estimate the uncertainties associated with velocity and velocity dispersion. The values reported in Table 3 are instead those obtained with the best-fit configuration on the original observed spectrum.
Current usage metrics show cumulative count of Article Views (full-text article views including HTML views, PDF and ePub downloads, according to the available data) and Abstracts Views on Vision4Press platform.
Data correspond to usage on the plateform after 2015. The current usage metrics is available 48-96 hours after online publication and is updated daily on week days.
Initial download of the metrics may take a while.