Fig. 4.
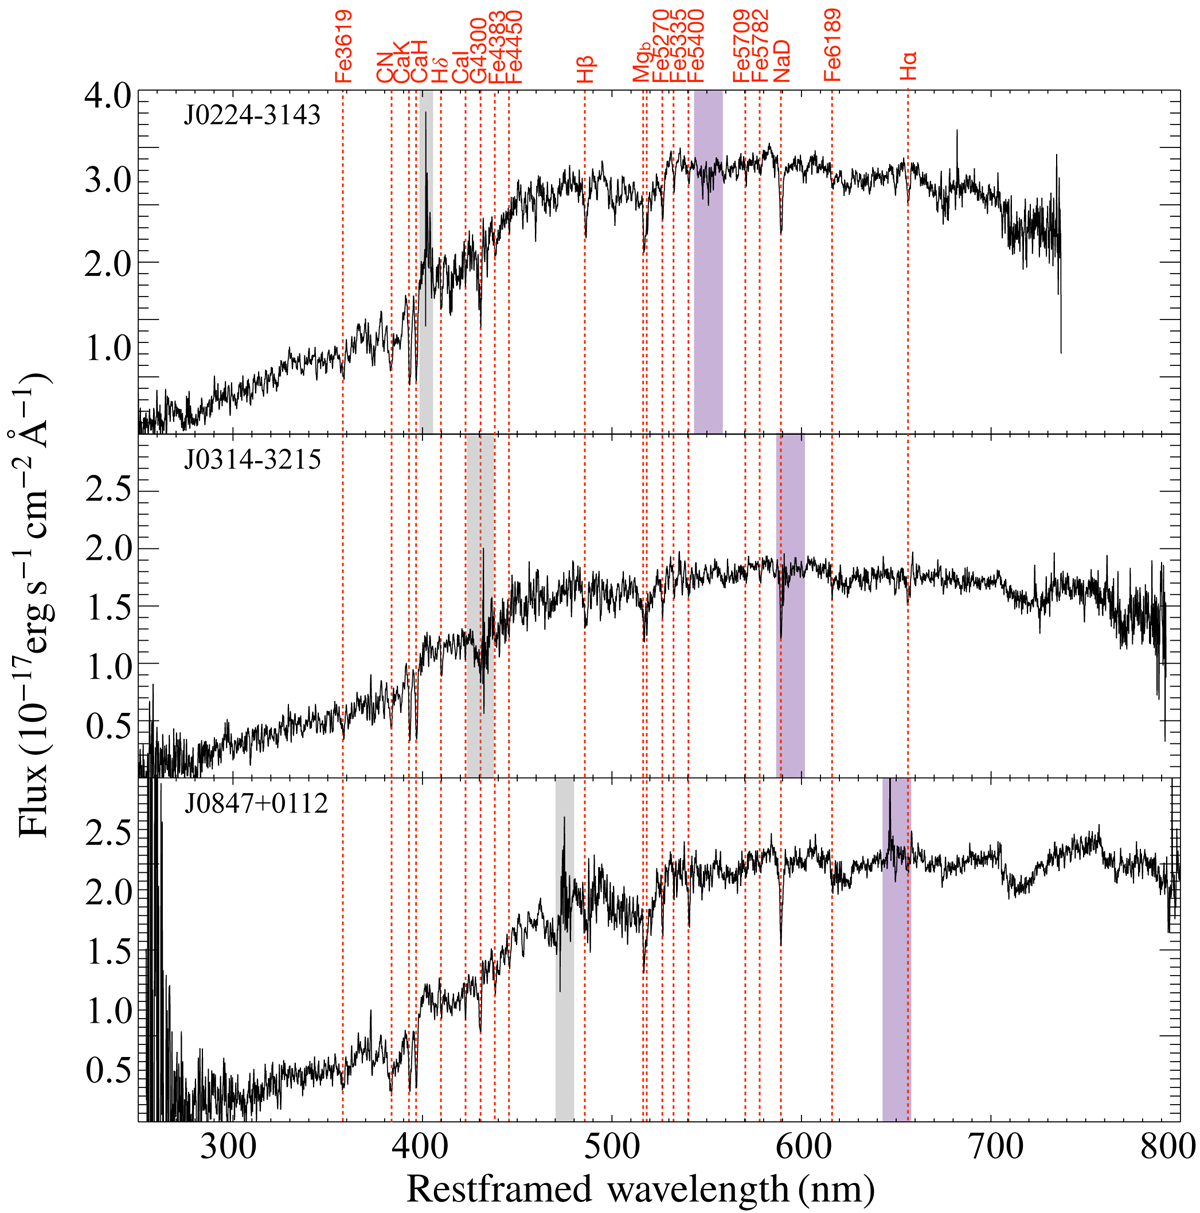
Final 1D spectra extracted from an aperture of five pixels (±0.4″ from the photometric centre) for the three systems presented in this pilot paper, from the one at highest redshift (KiDS J0224−3143, top panel) to the one at the lowest redshift (KiDS J0847+0112, bottom panel). The spectra are plotted in rest-framed wavelength and fluxes (in units of 10−17 erg s−1 cm−2 Å−1). Red dashed lines highlight the stellar absorption lines, typical of ETGs, that are used to derive stellar kinematics and population parameters. Grey vertical shaded boxes show the regions where the UVB and VIS spectra were joined for each system. The purple boxes show regions contaminated by telluric lines that we corrected with MOLECFIT.
Current usage metrics show cumulative count of Article Views (full-text article views including HTML views, PDF and ePub downloads, according to the available data) and Abstracts Views on Vision4Press platform.
Data correspond to usage on the plateform after 2015. The current usage metrics is available 48-96 hours after online publication and is updated daily on week days.
Initial download of the metrics may take a while.