Fig. C.1.
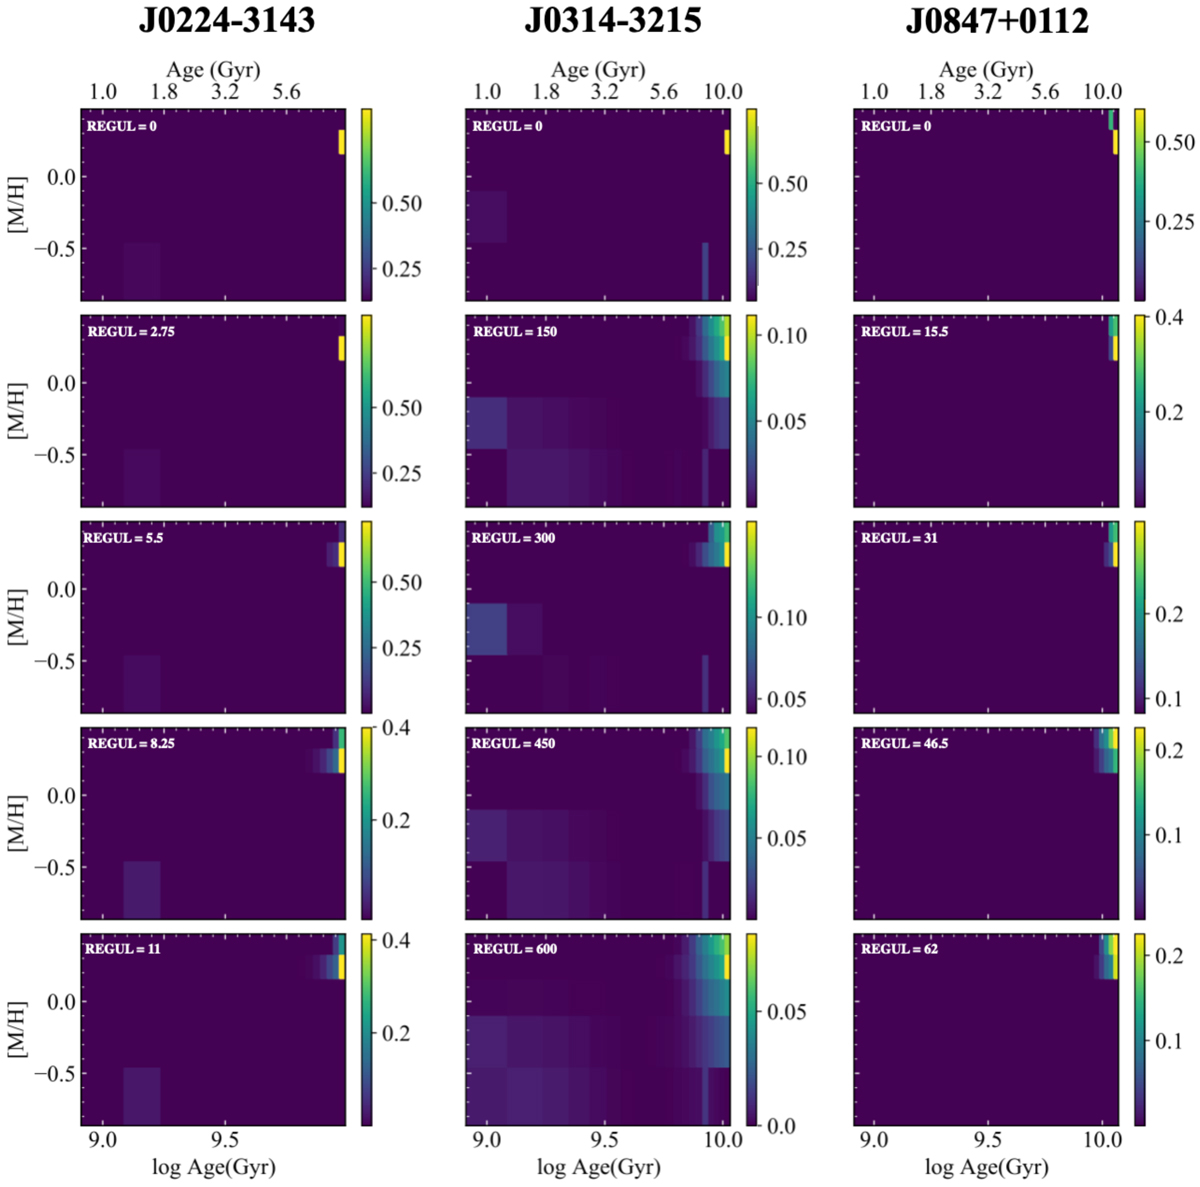
2D density plot showing the weights attributed to the SSP models by PPXF during the fit, in a log (age), [M/H] space (for simplicity, we also plot ages in linear scale on the top x-axis). Each column shows results for a different galaxy, while each row corresponds to the different results obtaining increasing the REGUL from 0 (top) to MAX_REGUL (bottom). The weight fractions are reported on the vertical colour-bars, where yellow indicates the maximum weight and dark blue indicates zero weight. The upper limit of the age axis is slightly higher (∼10%) than the age of the Universe at the redshift of the objects, in order to take into account possible uncertainties in the value computed from the stellar population analysis.
Current usage metrics show cumulative count of Article Views (full-text article views including HTML views, PDF and ePub downloads, according to the available data) and Abstracts Views on Vision4Press platform.
Data correspond to usage on the plateform after 2015. The current usage metrics is available 48-96 hours after online publication and is updated daily on week days.
Initial download of the metrics may take a while.