Fig. 1.
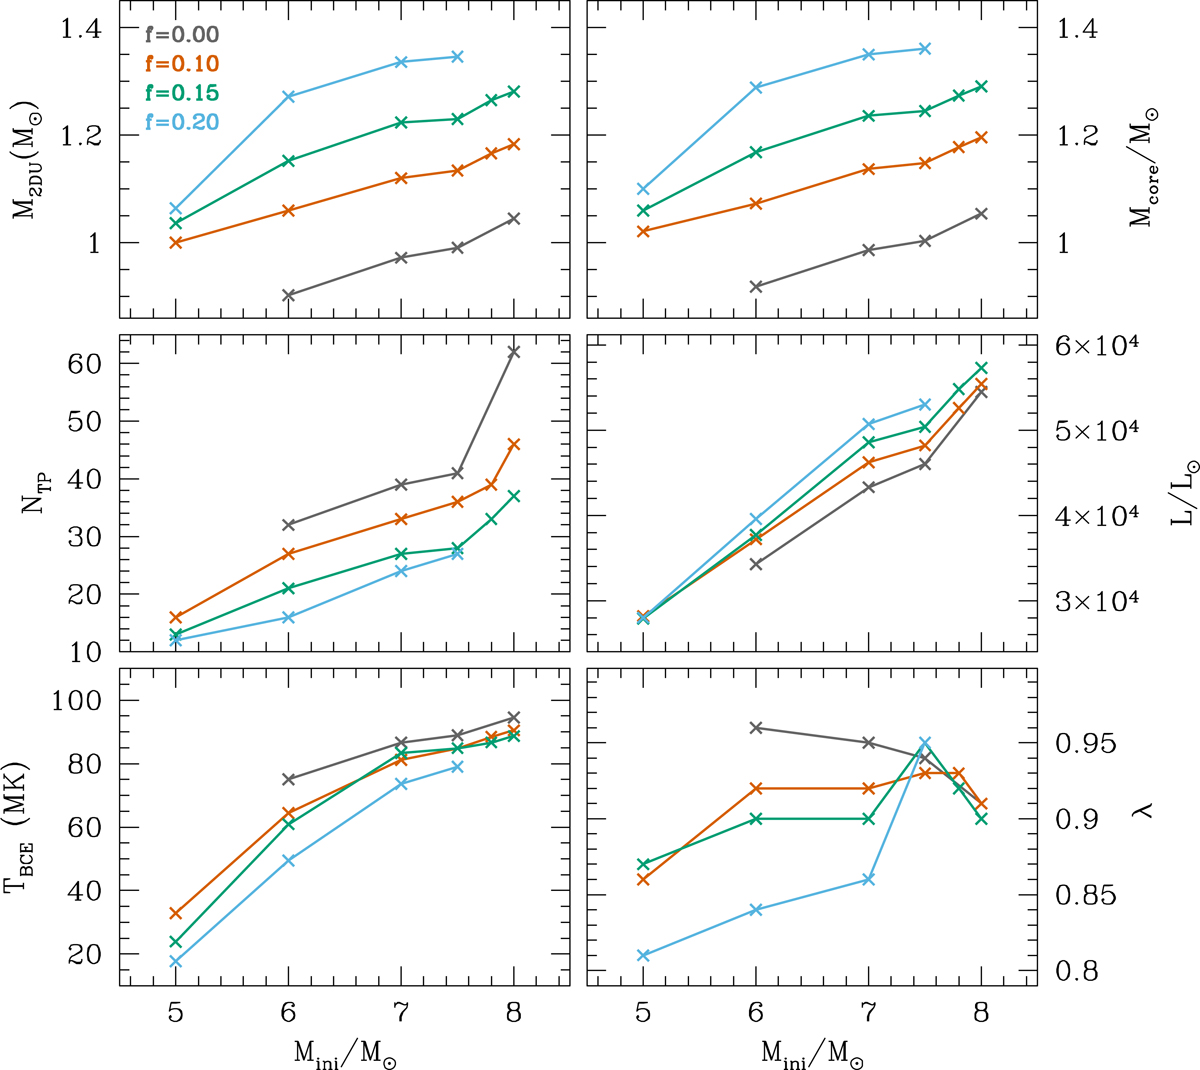
Upper panels: H-exhausted core mass at the maximum advance of the SDU (left) and at the end of our calculations (right). Middle panels: number of thermal pulses of our sequences (left) and maximum surface luminosity values reached during the TP-AGB (right). Lower panels: maximum temperature at the base of the convective envelope (left) and maximum TDU parameter (right). All values are given with respect to the initial model masses. Black lines and symbols represent cases with no rotation, orange, green, and blue represent, respectively, cases with rotation and f = 0.1, 0.15, and 0.2.
Current usage metrics show cumulative count of Article Views (full-text article views including HTML views, PDF and ePub downloads, according to the available data) and Abstracts Views on Vision4Press platform.
Data correspond to usage on the plateform after 2015. The current usage metrics is available 48-96 hours after online publication and is updated daily on week days.
Initial download of the metrics may take a while.