Fig. 9
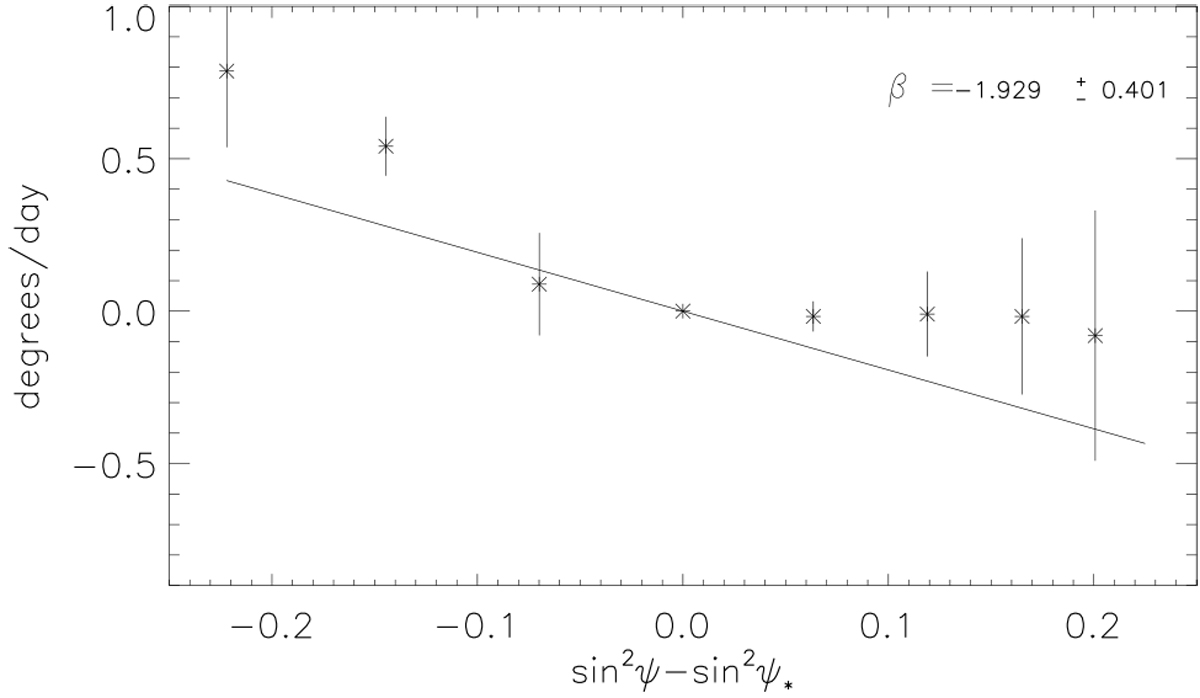
Phase shifts between the five temperature maps obtained from the SONG data for set01–set05. The constant movement of the spots has been removed from the measurements, by removing the shift at the lowest latitude (ψ* = 60.25°) that always has spots. The plot gives the average phase shifts in degrees per day plotted against sin 2 (ψ) − sin2(ψ*). The error bars indicate the standard deviation. The weighted fit of the function f(ψ) = β(sin2(ψ) − sin2(ψ*)) to the measurements is shown as a straight line.
Current usage metrics show cumulative count of Article Views (full-text article views including HTML views, PDF and ePub downloads, according to the available data) and Abstracts Views on Vision4Press platform.
Data correspond to usage on the plateform after 2015. The current usage metrics is available 48-96 hours after online publication and is updated daily on week days.
Initial download of the metrics may take a while.