Fig. 8
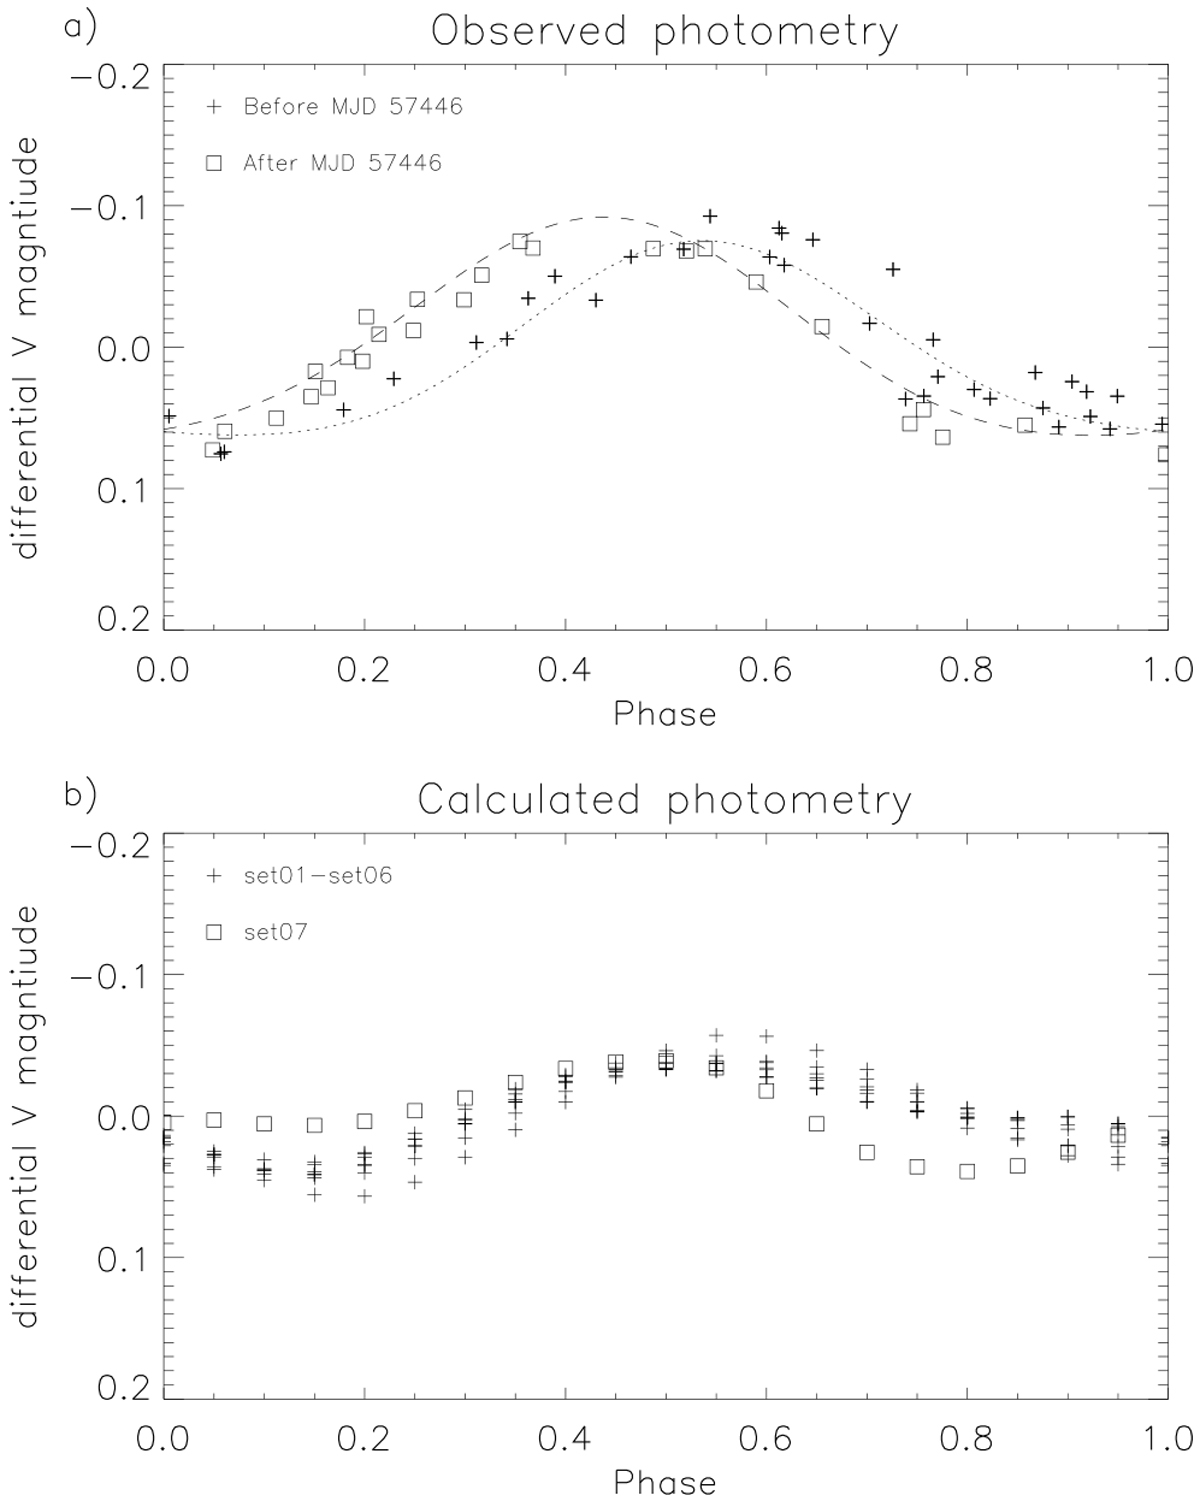
Comparison of the observed brightness (a) with the brightness computed from the Doppler images (b). In both cases the observations before the phase jump, which occurred around MJD = 57446, are denoted with plus-signs. The observations after the phase jump are marked with squares. In (a) the dotted line is the harmonic fit to the observations before the phase jump and the dashed line the harmonic fit to the observationsafter the phase jump.
Current usage metrics show cumulative count of Article Views (full-text article views including HTML views, PDF and ePub downloads, according to the available data) and Abstracts Views on Vision4Press platform.
Data correspond to usage on the plateform after 2015. The current usage metrics is available 48-96 hours after online publication and is updated daily on week days.
Initial download of the metrics may take a while.