Fig. 6
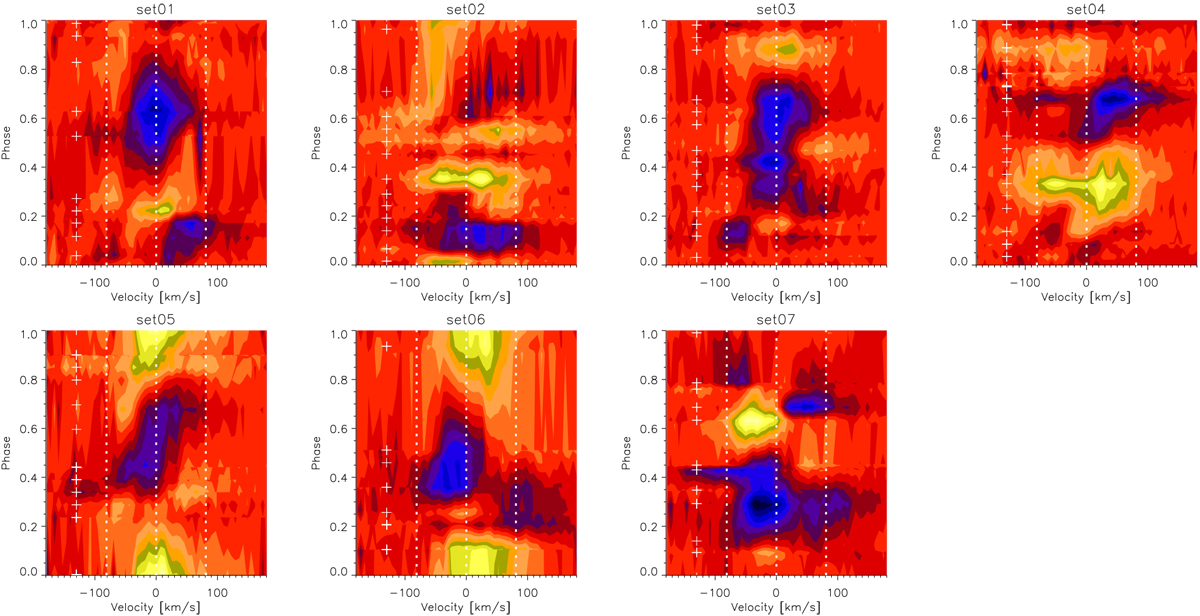
Dynamic Hα residual spectra of σ Gem with the average line profile subtracted. The yellow denotes areas of increased emission and the blue areas of enhanced absorption in comparison to the average level. Crosses on the left show the phases of individual spectra. The dotted lines mark the blue shifted line wing, line core, and the redshifted line wing of the Hα line profile.
Current usage metrics show cumulative count of Article Views (full-text article views including HTML views, PDF and ePub downloads, according to the available data) and Abstracts Views on Vision4Press platform.
Data correspond to usage on the plateform after 2015. The current usage metrics is available 48-96 hours after online publication and is updated daily on week days.
Initial download of the metrics may take a while.