Fig. 9
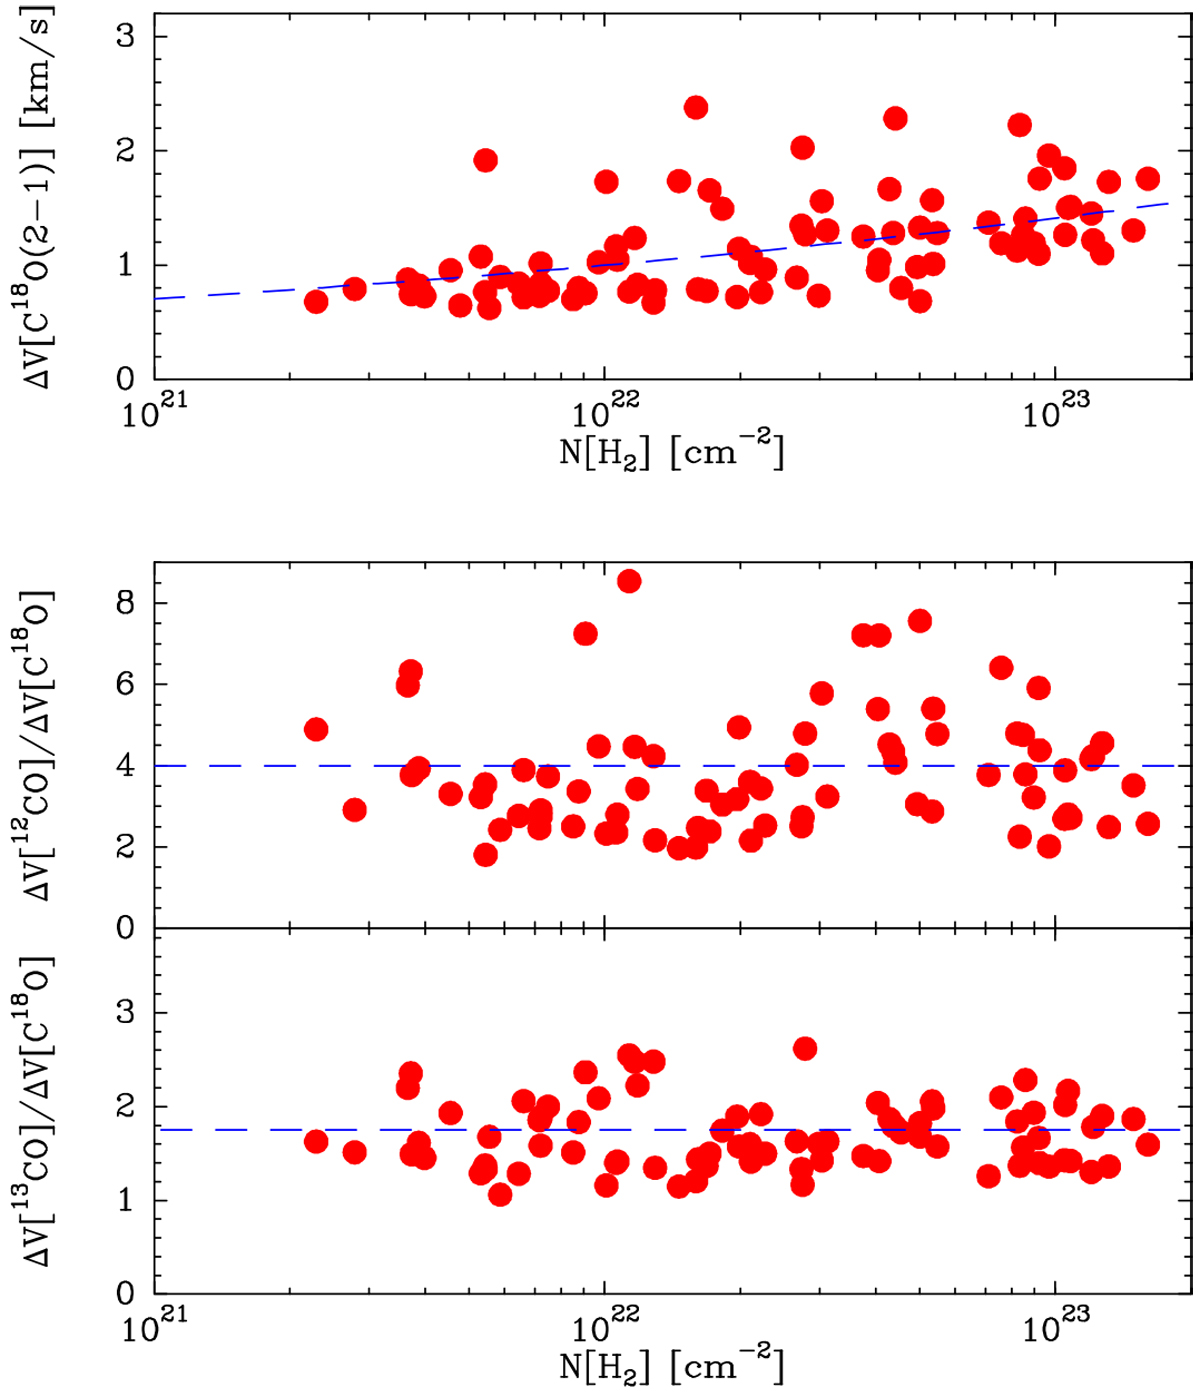
Gas internal motions. Top: C18O(2–1) FWHM linewidth as a function of H2 column density derived from Gaussian fits to the spectra (red circles). The dashed line represents an analytic approximation used to model the trend. Bottom: linewidth ratios of the two main CO isotopologs over C18 O. The dashed lines represent the constant ratios used in the model (4 for 12CO and 1.75 for 13CO).
Current usage metrics show cumulative count of Article Views (full-text article views including HTML views, PDF and ePub downloads, according to the available data) and Abstracts Views on Vision4Press platform.
Data correspond to usage on the plateform after 2015. The current usage metrics is available 48-96 hours after online publication and is updated daily on week days.
Initial download of the metrics may take a while.