Fig. 8
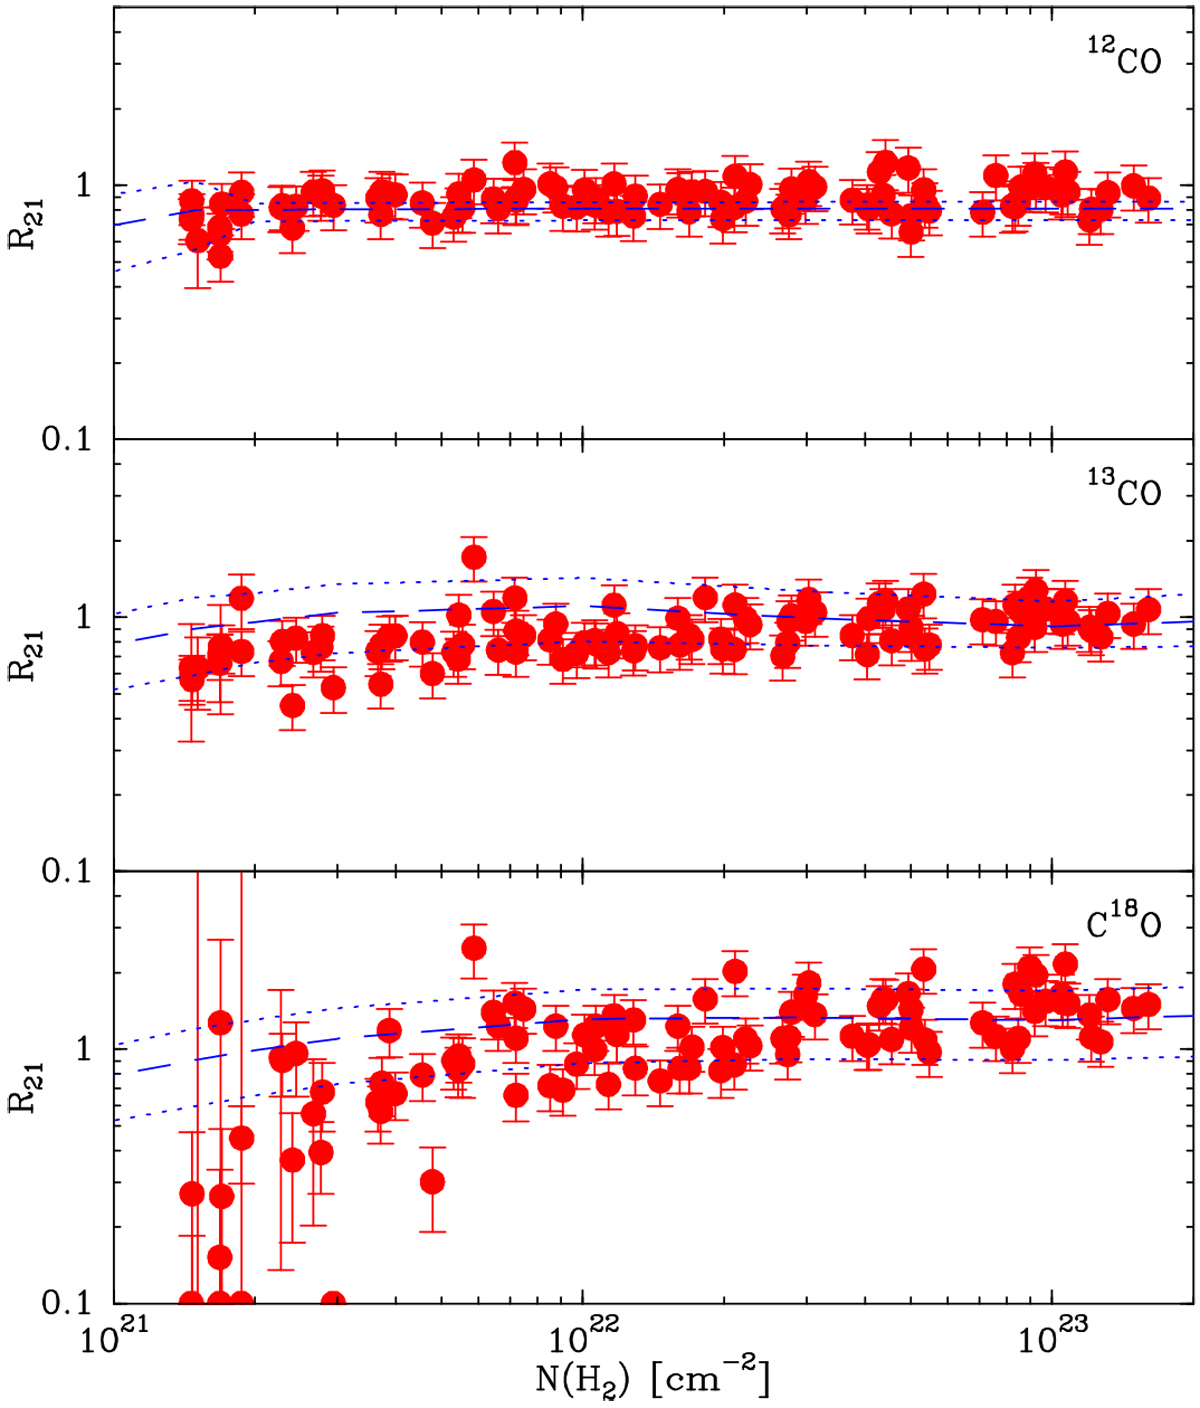
Ratio between J = 2–1 and J = 1–0 integrated intensities as a function of H2 column density for the three CO isotopologs for which both transitions were observed (red circles). The blue dashed line represents the prediction from a radiative transfer model of an isothermal cloud at 11 K. The dotted lines represent similar models for 15 K (higher curve) and 7.5 K (lower curve).
Current usage metrics show cumulative count of Article Views (full-text article views including HTML views, PDF and ePub downloads, according to the available data) and Abstracts Views on Vision4Press platform.
Data correspond to usage on the plateform after 2015. The current usage metrics is available 48-96 hours after online publication and is updated daily on week days.
Initial download of the metrics may take a while.