Free Access
Fig. 6
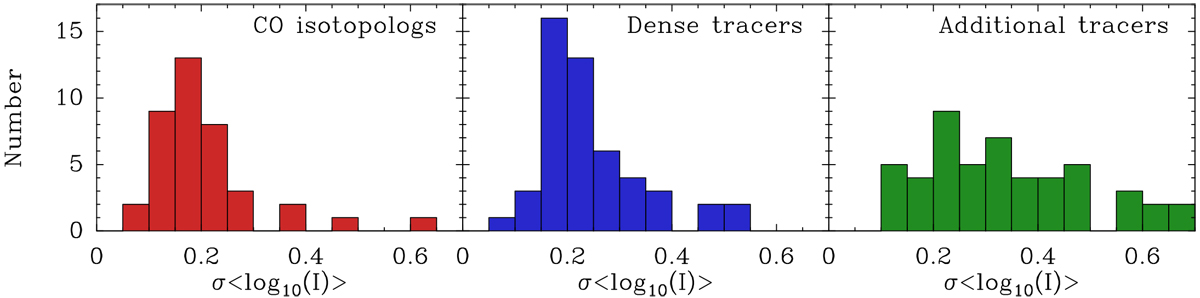
Dispersion histograms of logarithmic intensity for each column density bin. The panels show the combined dispersion for the family of CO isotopologs (left), the traditional dense gas tracers (middle), and the additional tracers (right). In all cases, the lowest column density bin has been excluded due to low sensitivity.
Current usage metrics show cumulative count of Article Views (full-text article views including HTML views, PDF and ePub downloads, according to the available data) and Abstracts Views on Vision4Press platform.
Data correspond to usage on the plateform after 2015. The current usage metrics is available 48-96 hours after online publication and is updated daily on week days.
Initial download of the metrics may take a while.