Fig. D.1
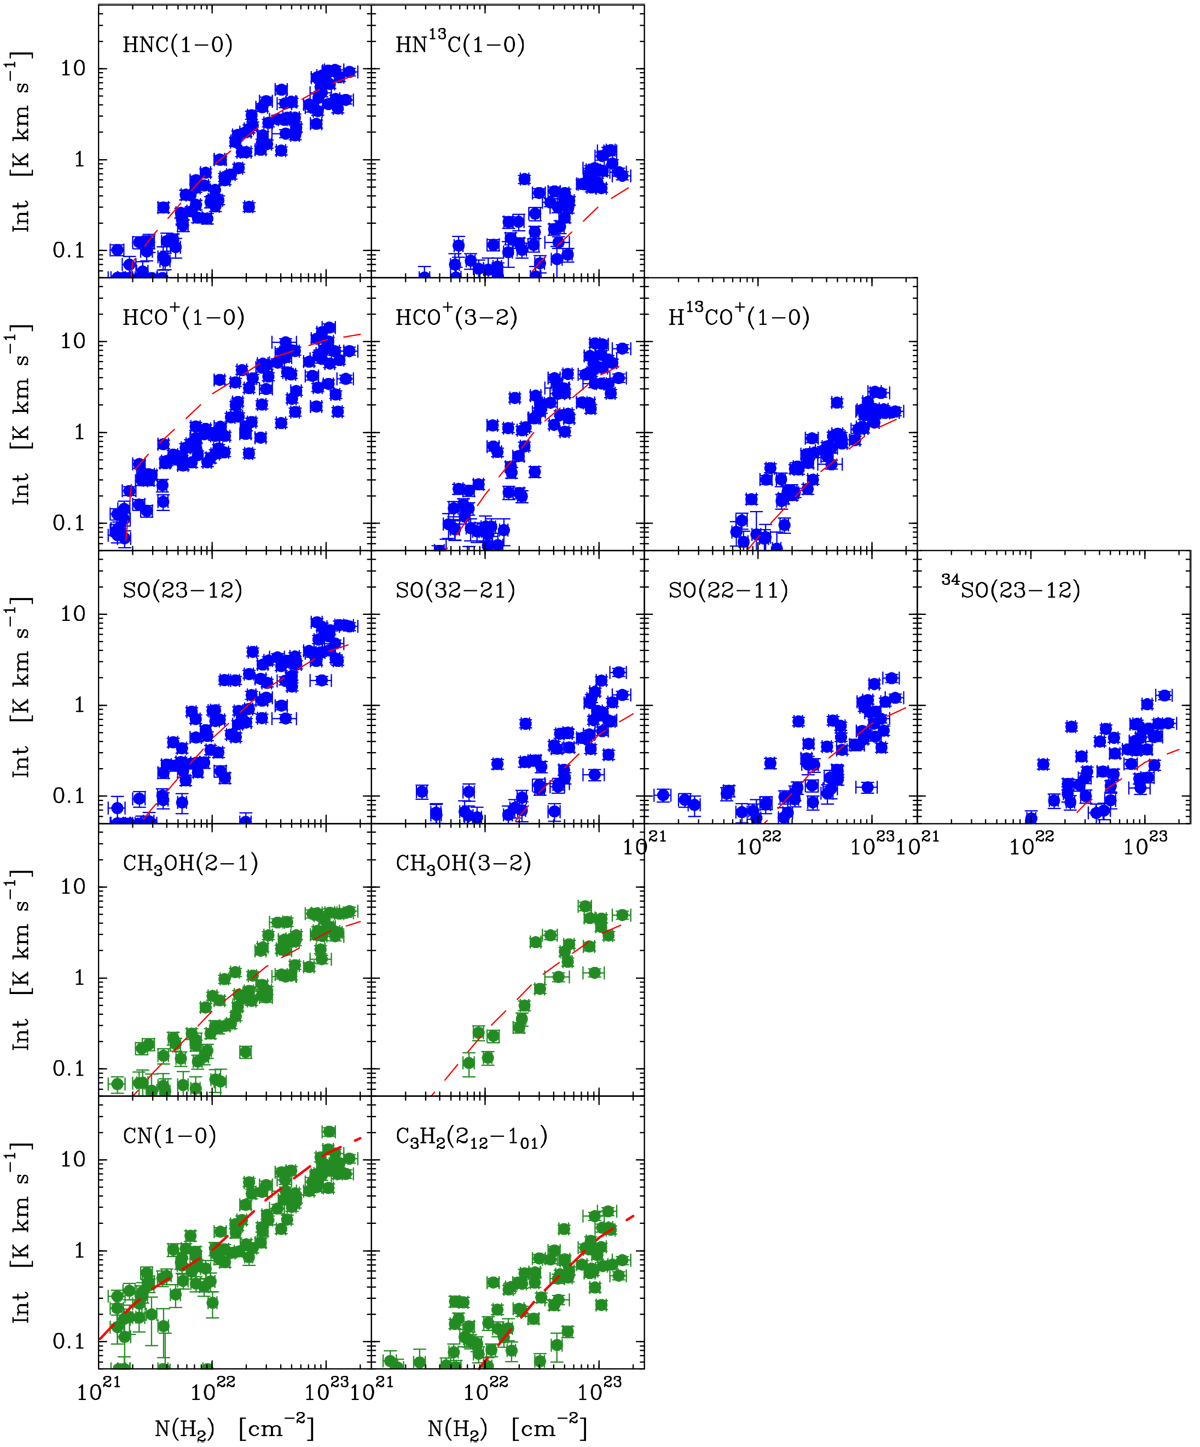
Comparison between observations and model results for the species not presented in the main text. The data pointsrepresent the observations (traditional dense gas tracers in blue and additional tracers in green), and the red dashed lines represent the model results. Each panel row contains all observed transitions and isotopologs of any given molecular species, except for the last row that shows together the only observed lines of CN and C3 H2. Several SO and C3H2 points can be seen above the plot lower limit at very low column densities. A visual inspection of their spectra suggests that they represent noise or baseline residuals, and not true molecular emission.
Current usage metrics show cumulative count of Article Views (full-text article views including HTML views, PDF and ePub downloads, according to the available data) and Abstracts Views on Vision4Press platform.
Data correspond to usage on the plateform after 2015. The current usage metrics is available 48-96 hours after online publication and is updated daily on week days.
Initial download of the metrics may take a while.