Free Access
Fig. C.1
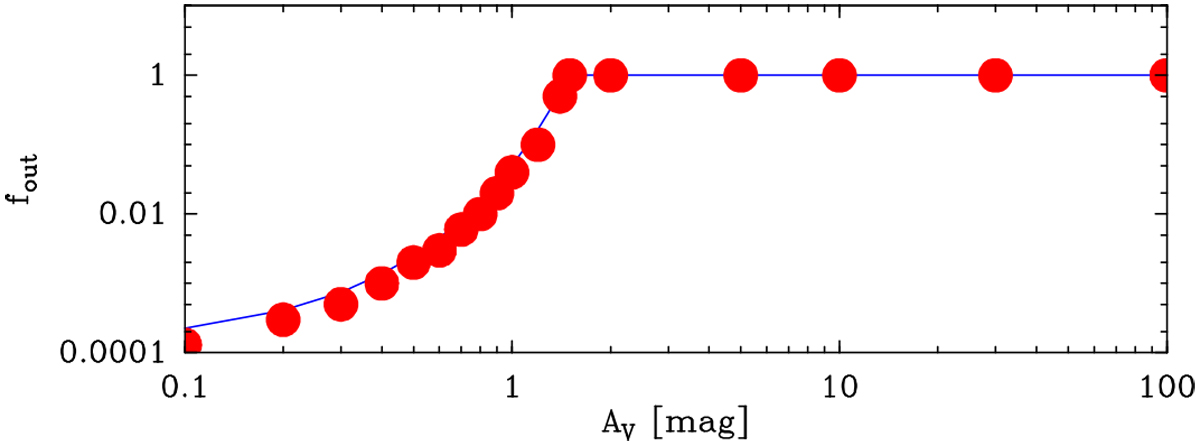
Abundance factor used to model the cloud photodissociation edge. The red symbols represent values of the CO abundance predicted by the F1 PDR model of Röllig et al. (2007) and extracted from their Fig. 4b. The solid blue line is the analytic expression described in the text for a choice of A0 = 1.5 mag.
Current usage metrics show cumulative count of Article Views (full-text article views including HTML views, PDF and ePub downloads, according to the available data) and Abstracts Views on Vision4Press platform.
Data correspond to usage on the plateform after 2015. The current usage metrics is available 48-96 hours after online publication and is updated daily on week days.
Initial download of the metrics may take a while.